Fig. 8.
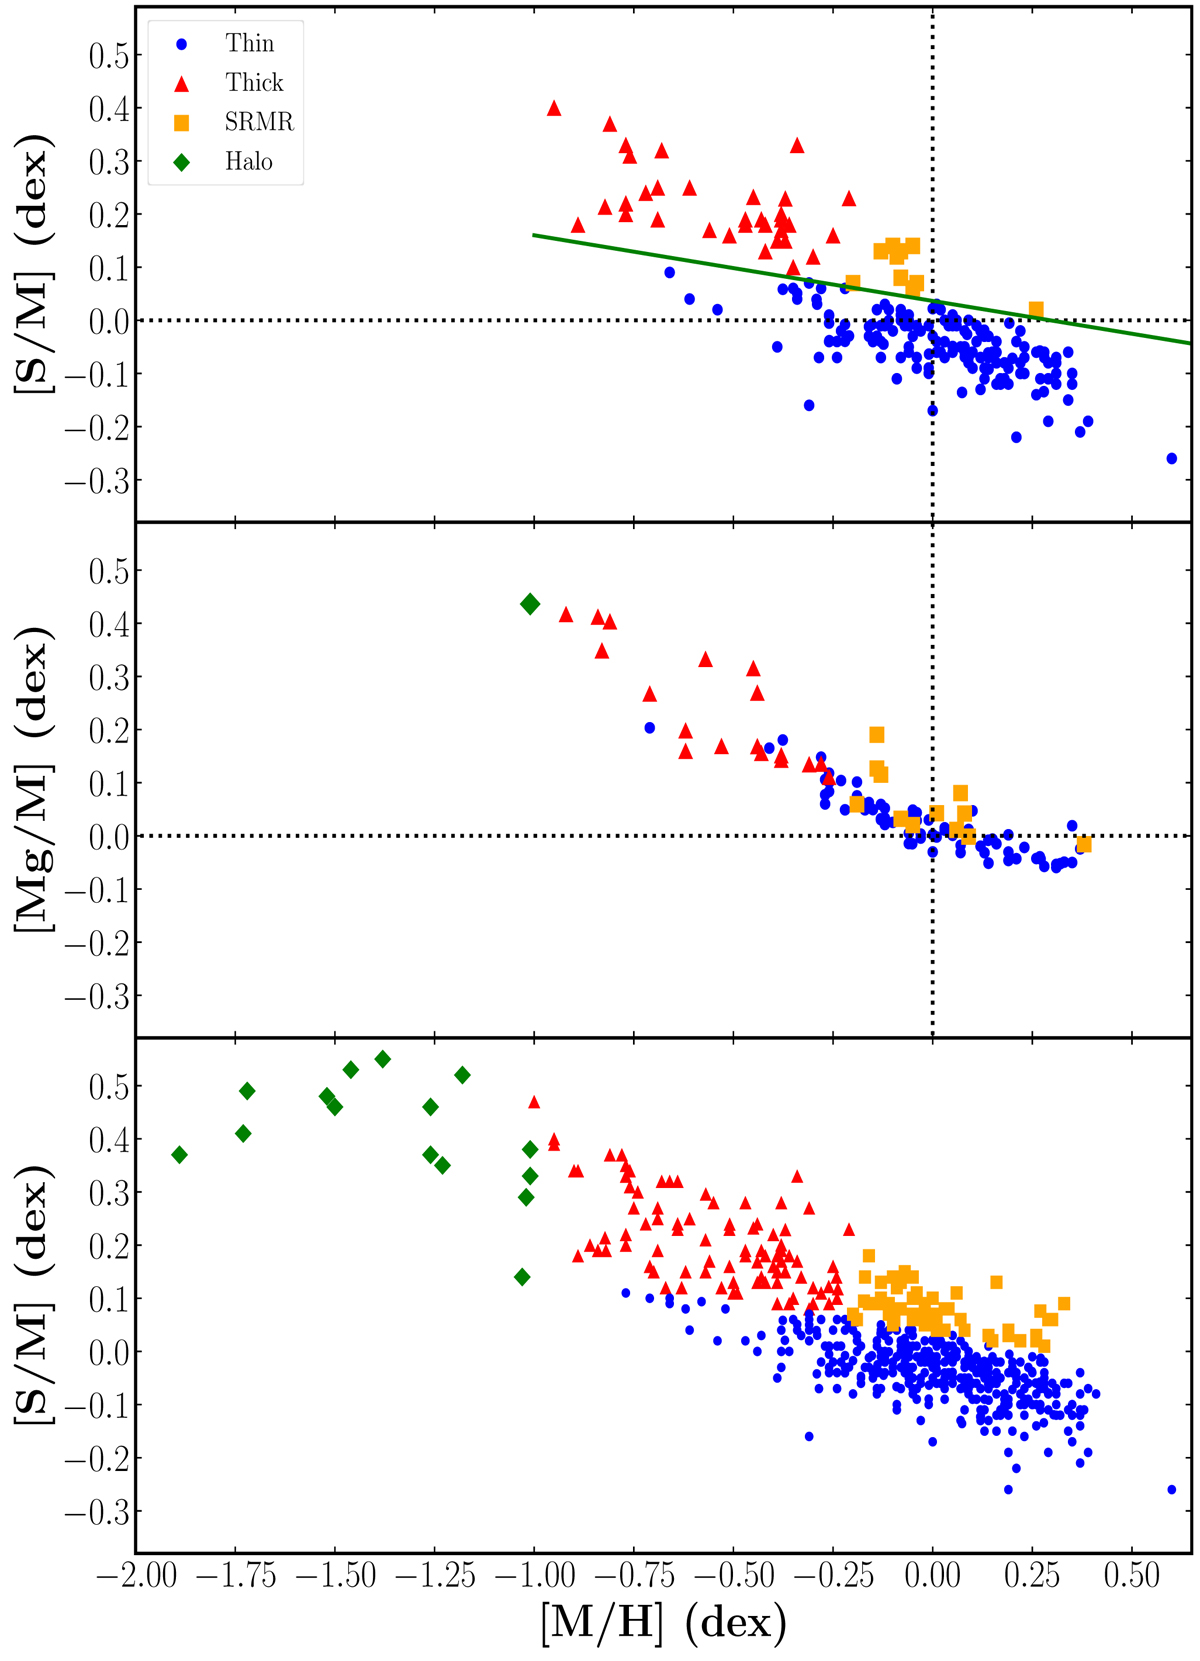
Top: ratio of sulfur abundance to mean metallicity [S/M] vs. mean metallicity [M/H] for stars with the best measured sulfur abundances (large number of analysed spectra, at least three measurements of the three S I lines available and small dispersion). The green line shows the adopted separation between the sulfur-rich and sulfur-poor stars. Middle: [Mg/M] ratio vs. [M/H] for the stars in common with Santos-Peral et al. (2020a). Bottom: same as top panel, but for the complete sample of 540 stars with the best derived abundances (same sample as in Fig. 3, second panel), and labelled according to their Galactic population membership. In all these panels thin-disc, thick-disc, sulfur-rich, metal-rich, and halo stars are shown as blue filled circles, red triangles, orange squares, and green diamonds, respectively.
Current usage metrics show cumulative count of Article Views (full-text article views including HTML views, PDF and ePub downloads, according to the available data) and Abstracts Views on Vision4Press platform.
Data correspond to usage on the plateform after 2015. The current usage metrics is available 48-96 hours after online publication and is updated daily on week days.
Initial download of the metrics may take a while.