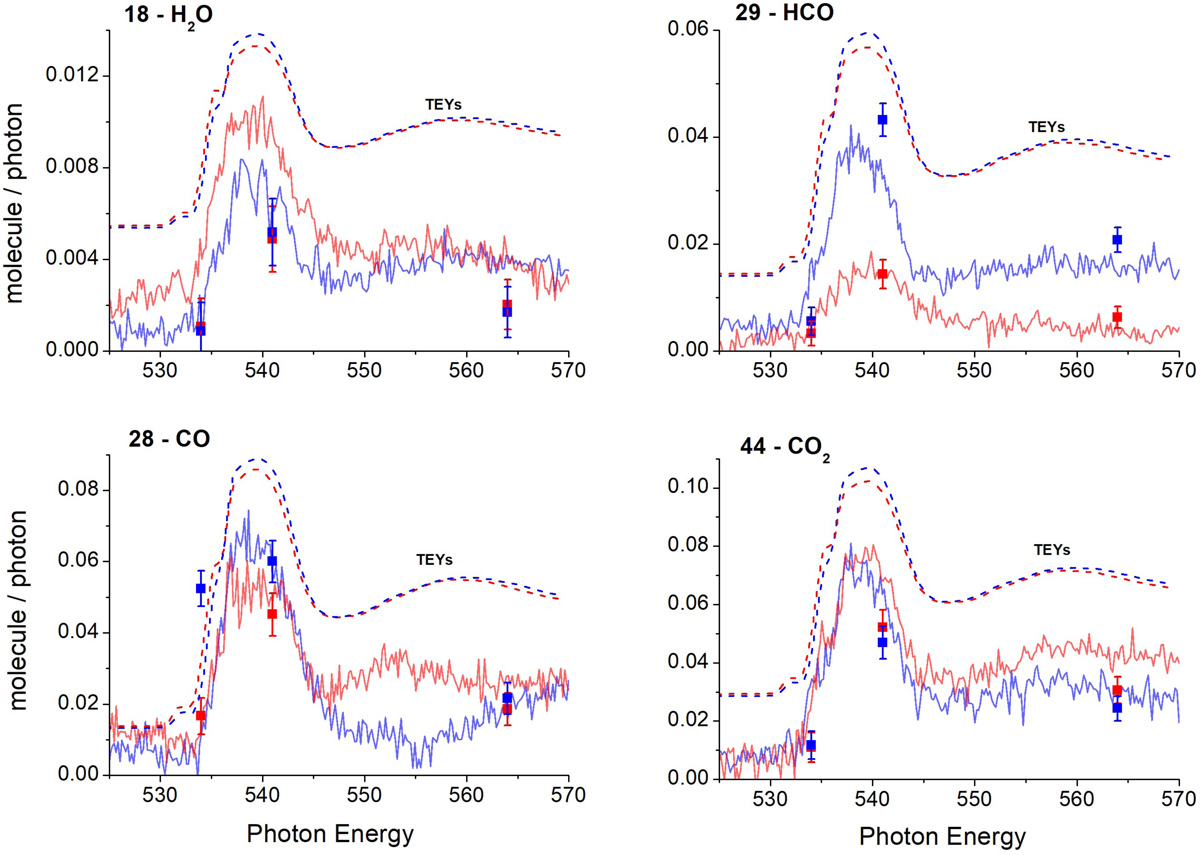
Fig. 3.

Photodesorption spectra for masses 18, 28, 29, and 44 in molecule/photon from H2O:CH3OH ice at 15 K, with the associated molecules. Red and blue are associated with a mixing ratio of 1.5:1 and 3:1, respectively. The measurements at fixed energy are associated with a fluence before irradiation of 1 × 10¹⁶ ph cm−2 and are represented by the squares with error bars. The scan experiments are associated with a fluence before irradiation of 3 × 10¹⁷ ph cm−2 and are represented by solid lines. The TEYs measured during the scan experiments are also shown in arbitrary units by the dashed lines. The photodesorption yields displayed are not corrected for any dilution factor.
Current usage metrics show cumulative count of Article Views (full-text article views including HTML views, PDF and ePub downloads, according to the available data) and Abstracts Views on Vision4Press platform.
Data correspond to usage on the plateform after 2015. The current usage metrics is available 48-96 hours after online publication and is updated daily on week days.
Initial download of the metrics may take a while.


