Fig. 7.
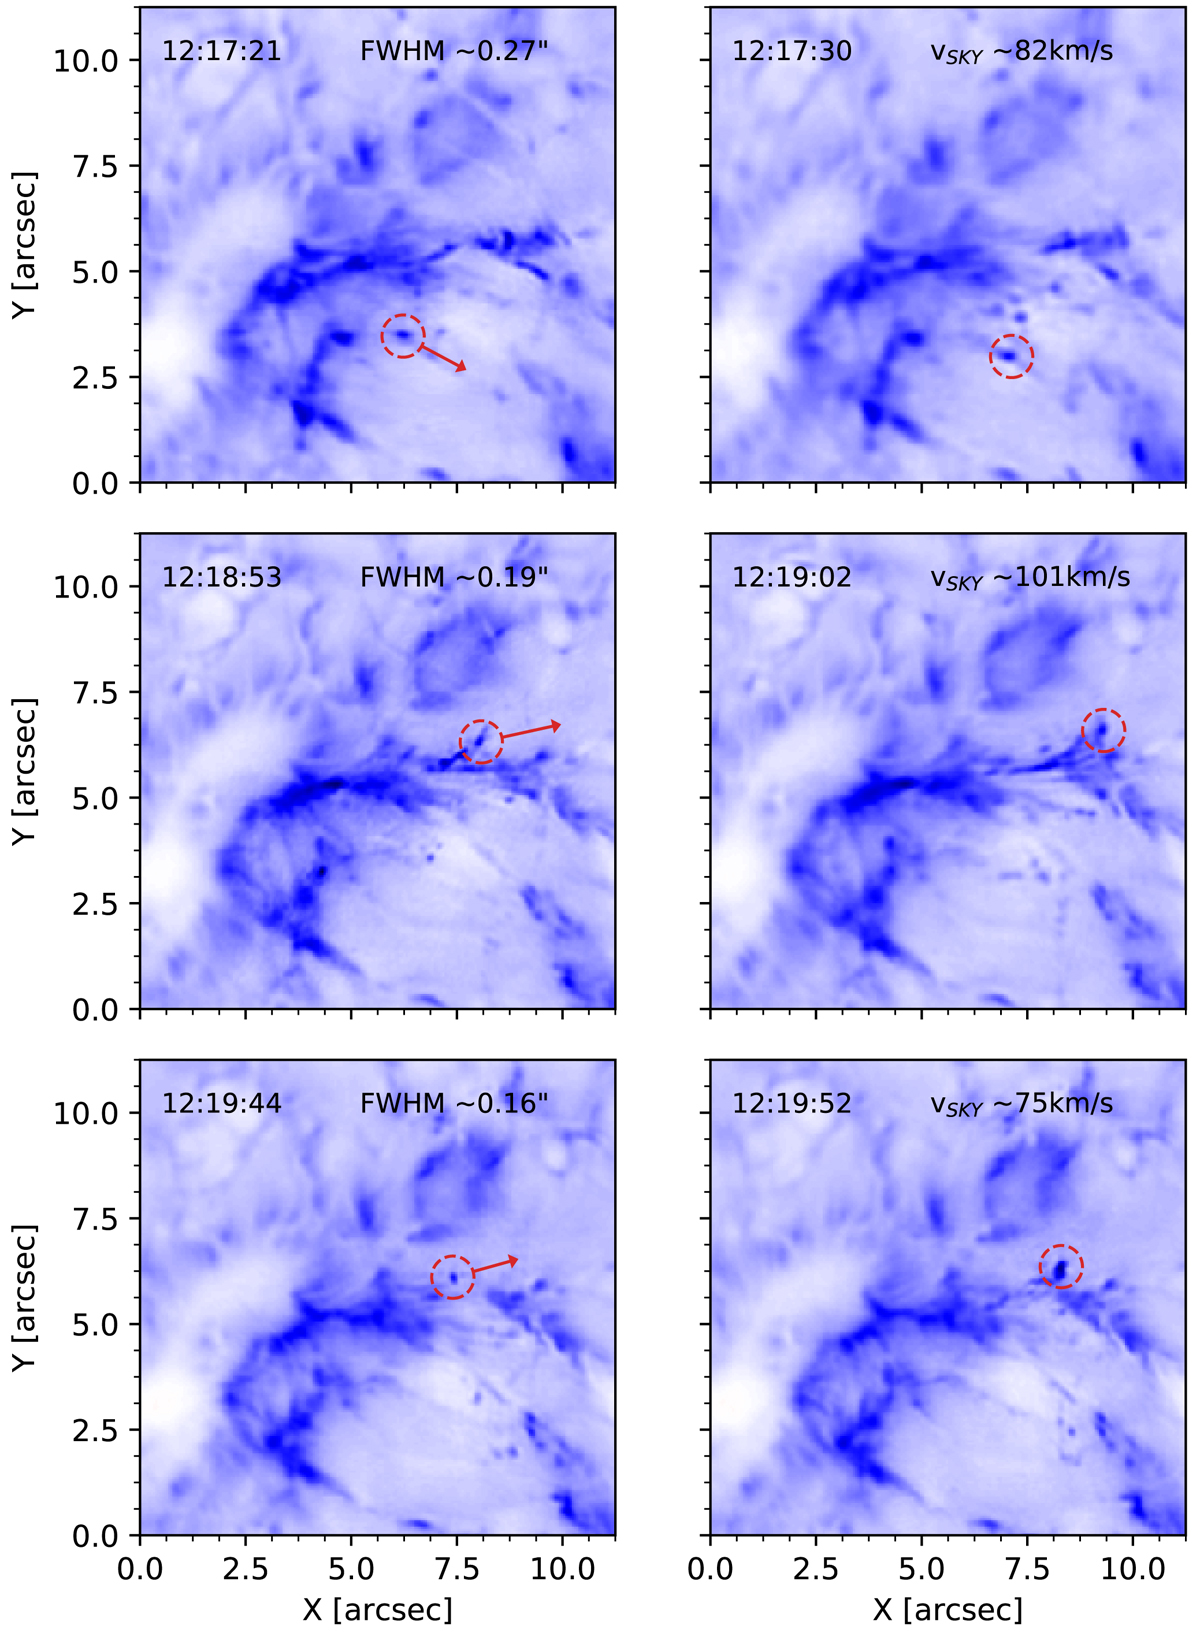
Monochromatic images in the blue wing of Ca II K (λ0 − 1.3 Å) at three temporal intervals. Each row shows a different blob. Red circles and arrows indicate the location and direction of the motion. FWHM inferred from the blobs are quoted in the right corner of the left panels. Transverse velocities are shown in the right panels.
Current usage metrics show cumulative count of Article Views (full-text article views including HTML views, PDF and ePub downloads, according to the available data) and Abstracts Views on Vision4Press platform.
Data correspond to usage on the plateform after 2015. The current usage metrics is available 48-96 hours after online publication and is updated daily on week days.
Initial download of the metrics may take a while.