Fig. 5.
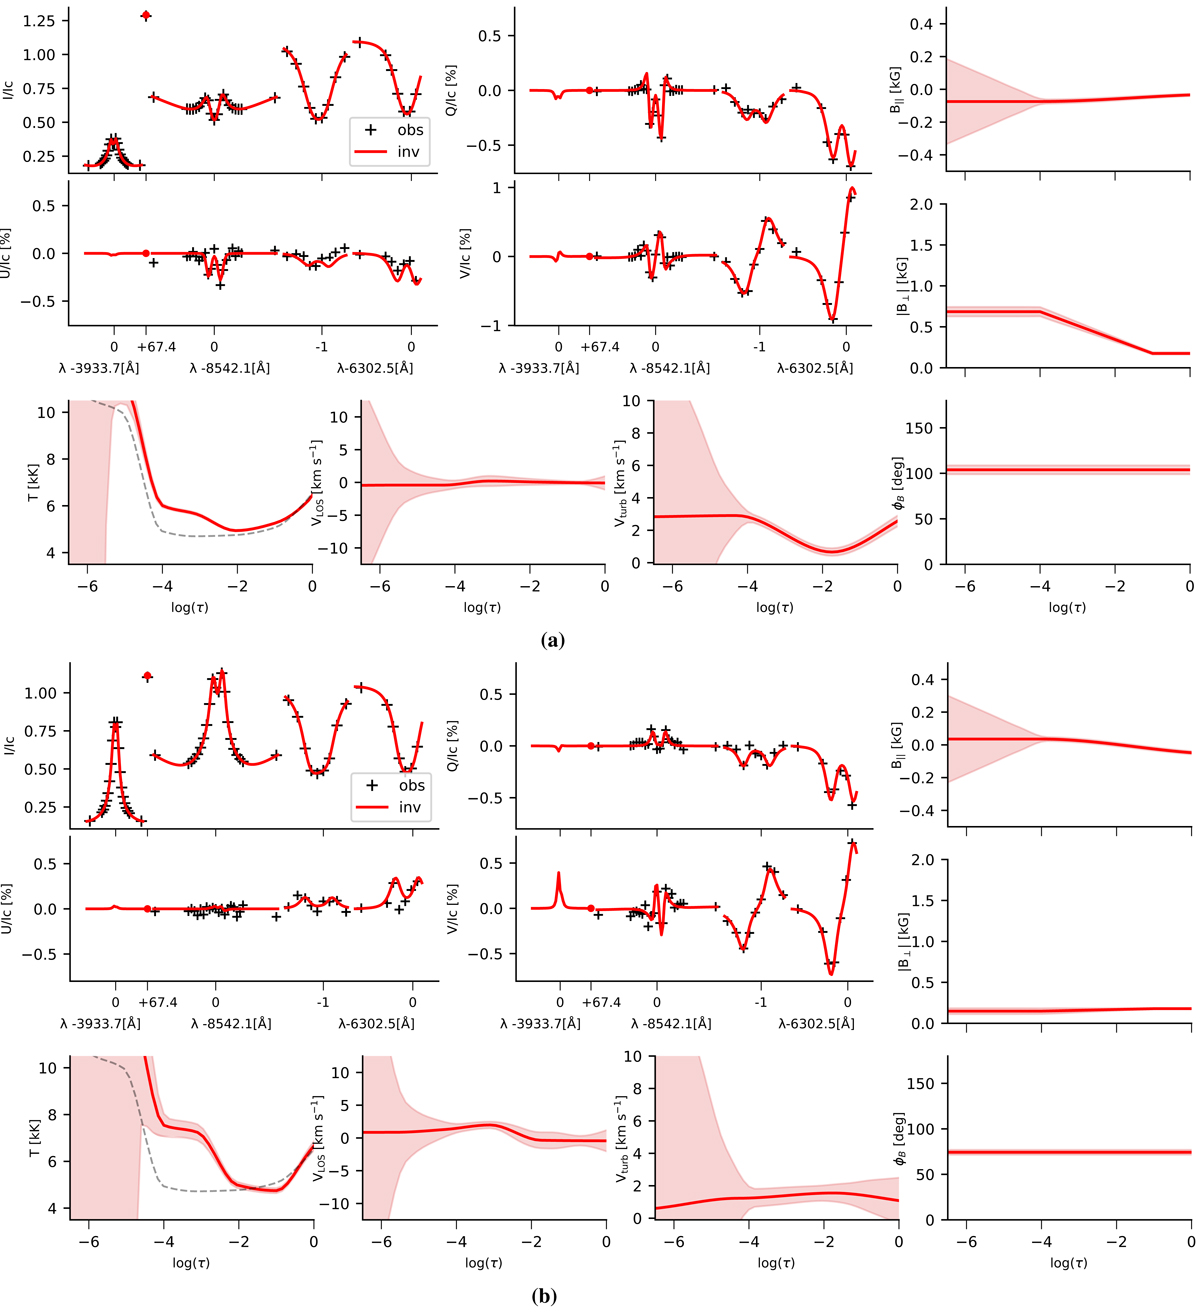
Examples of spectra (observed in black and synthetic in red) with the corresponding inferred atmosphere. Red shaded bands indicate node uncertainties. The location of each pixel is quoted in each panel. The gray dashed curve represents the average quiet-Sun temperature stratification. (a) Pixel (6.6″, 9.0″) is shown as blue ‘+’ symbol in Fig. 4. (b) Pixel (9.7″, 10.8″) is shown as black ‘x’ symbol in Fig. 4.
Current usage metrics show cumulative count of Article Views (full-text article views including HTML views, PDF and ePub downloads, according to the available data) and Abstracts Views on Vision4Press platform.
Data correspond to usage on the plateform after 2015. The current usage metrics is available 48-96 hours after online publication and is updated daily on week days.
Initial download of the metrics may take a while.