Fig. 4.
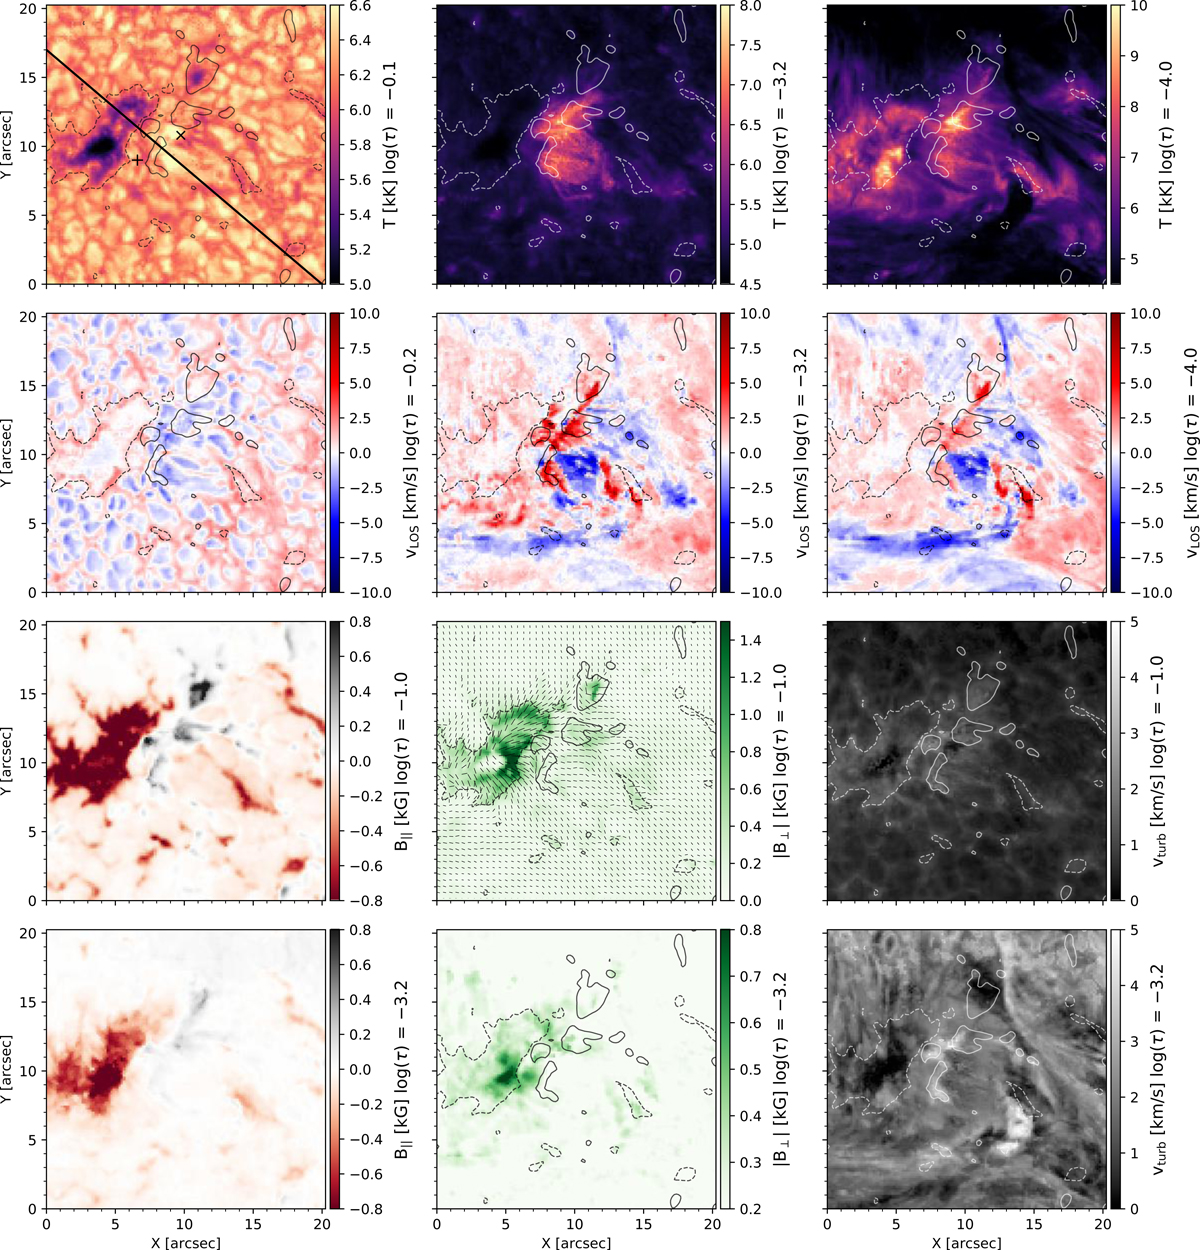
Atmospheric structure in the ROI as inferred from the inversion. The first and second rows show the temperature and the LOS velocity at three layers, and the third and fourth rows show the longitudinal magnetic field, the transverse magnetic field, and the microturbulent velocity at two layers. In the LOS velocity maps, the blue color represents motions toward the observer (upflows) while the red color represents motions from the observer (downflows). Crosses in the upper-left panel show the location of the pixel examples of Fig. 5 and the solid line the cross-cut shown in Fig. 12. Thin dashed and dotted contours are contours of B||(log(τ) = 0) = ± 200 G.
Current usage metrics show cumulative count of Article Views (full-text article views including HTML views, PDF and ePub downloads, according to the available data) and Abstracts Views on Vision4Press platform.
Data correspond to usage on the plateform after 2015. The current usage metrics is available 48-96 hours after online publication and is updated daily on week days.
Initial download of the metrics may take a while.