Fig. 3.
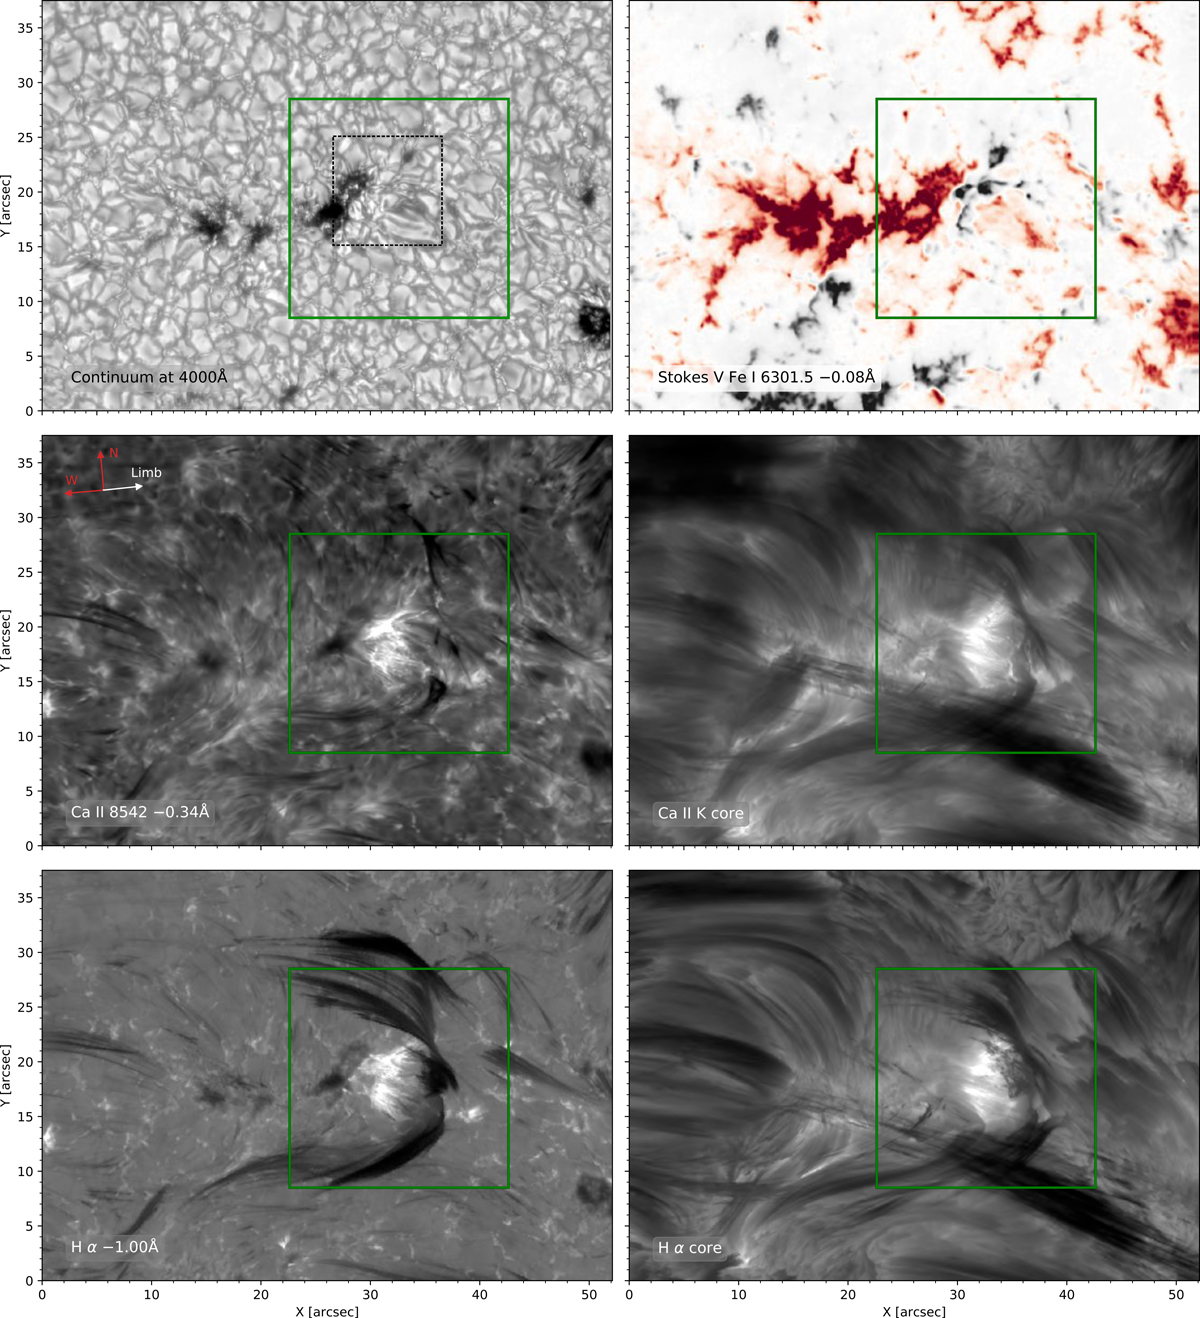
Overview images which overlap between the two instruments at four different wavelengths taken at 12:15 UT. The red arrows point to solar north and west, while the white arrows indicate the direction to the closest limb. The green square indicates our ROI which we analyzed in detail with the inversion code. The black dashed square is a close-up analyzed in Sect. 4.3.
Current usage metrics show cumulative count of Article Views (full-text article views including HTML views, PDF and ePub downloads, according to the available data) and Abstracts Views on Vision4Press platform.
Data correspond to usage on the plateform after 2015. The current usage metrics is available 48-96 hours after online publication and is updated daily on week days.
Initial download of the metrics may take a while.