Free Access
Fig. 10.
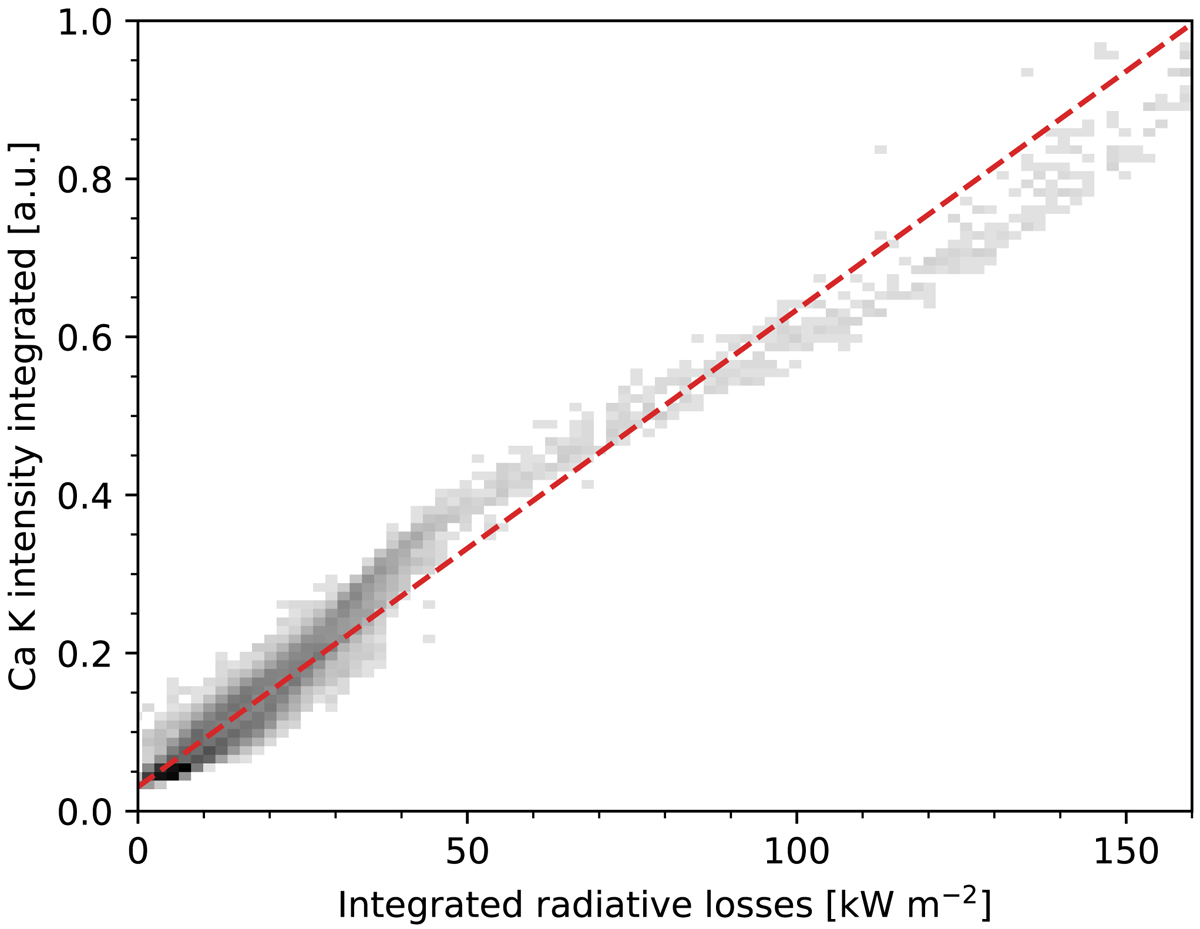
Joint probability distributions of the wavelength-summed Ca II K intensity and the total integrated radiative losses computed from the data shown in Fig. 9. The color of each bin is proportional to the logarithm of the number of points, with darker color indicating more points.
Current usage metrics show cumulative count of Article Views (full-text article views including HTML views, PDF and ePub downloads, according to the available data) and Abstracts Views on Vision4Press platform.
Data correspond to usage on the plateform after 2015. The current usage metrics is available 48-96 hours after online publication and is updated daily on week days.
Initial download of the metrics may take a while.