Free Access
Fig. 1.
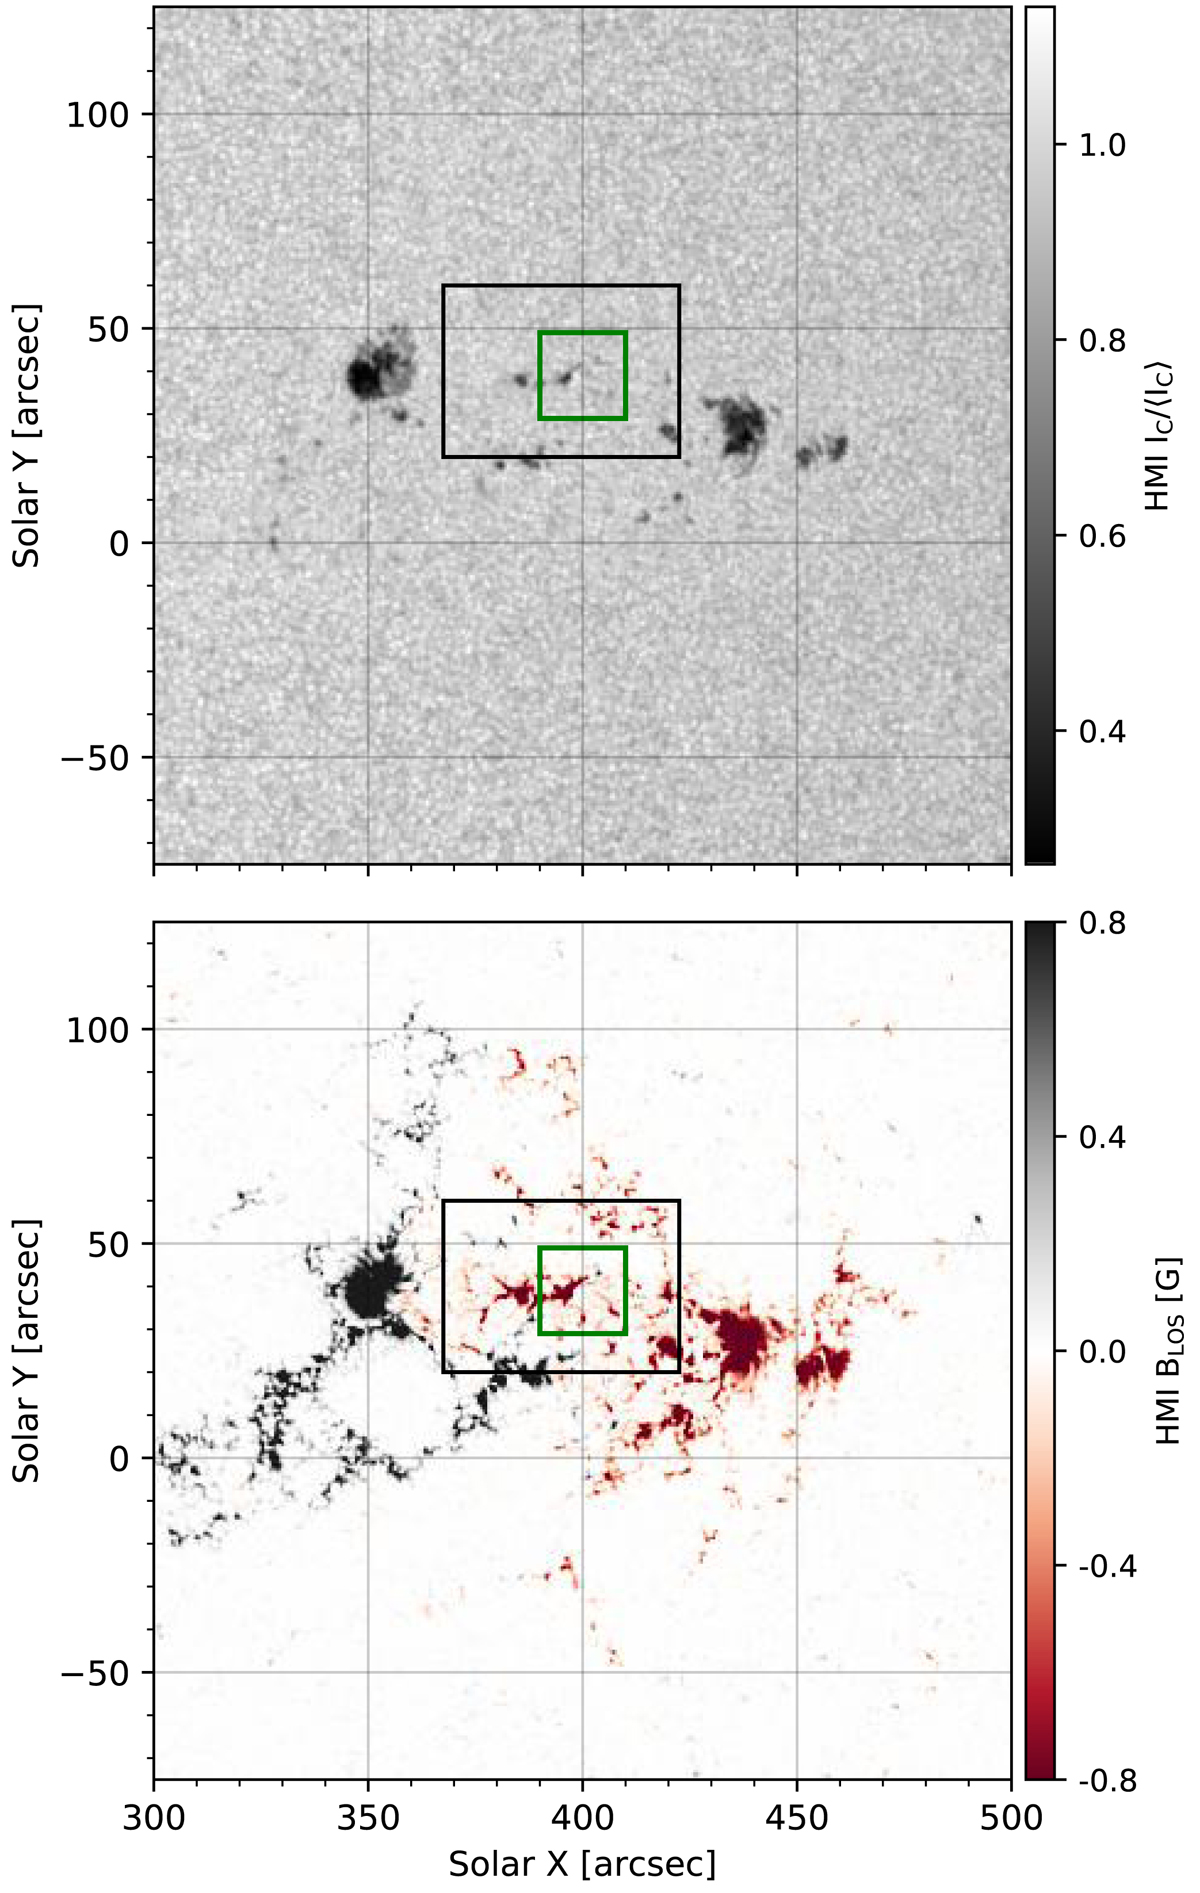
SDO/HMI continuum image and SDO/HMI LOS magnetogram of the active region NOAA 12593 at 12:15 h UT. The black square contour outlines the FOV covered by the SST and the smaller green square indicates the ROI.
Current usage metrics show cumulative count of Article Views (full-text article views including HTML views, PDF and ePub downloads, according to the available data) and Abstracts Views on Vision4Press platform.
Data correspond to usage on the plateform after 2015. The current usage metrics is available 48-96 hours after online publication and is updated daily on week days.
Initial download of the metrics may take a while.