Free Access
Fig. 4
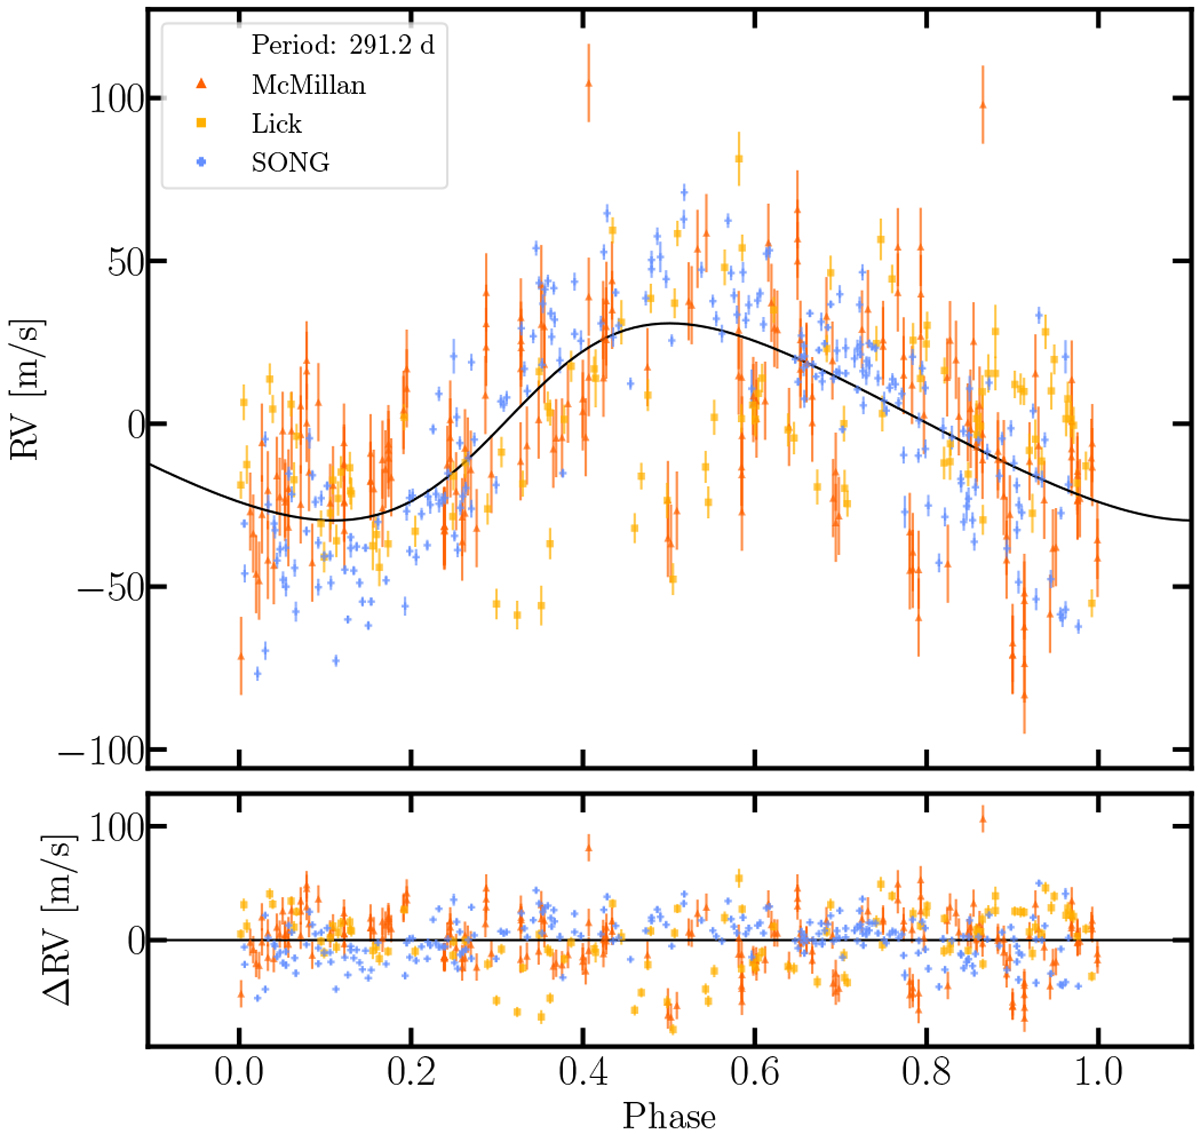
Top panel: RVs of the three modern data sets McMillan, Lick and SONG, phase-folded by the best-fit period of the putative planet P = 291.2 d, are shown in symbols along with the RV curve of the best fit as a black line. Bottom panel: residuals of the individual data points.
Current usage metrics show cumulative count of Article Views (full-text article views including HTML views, PDF and ePub downloads, according to the available data) and Abstracts Views on Vision4Press platform.
Data correspond to usage on the plateform after 2015. The current usage metrics is available 48-96 hours after online publication and is updated daily on week days.
Initial download of the metrics may take a while.