Fig. 3
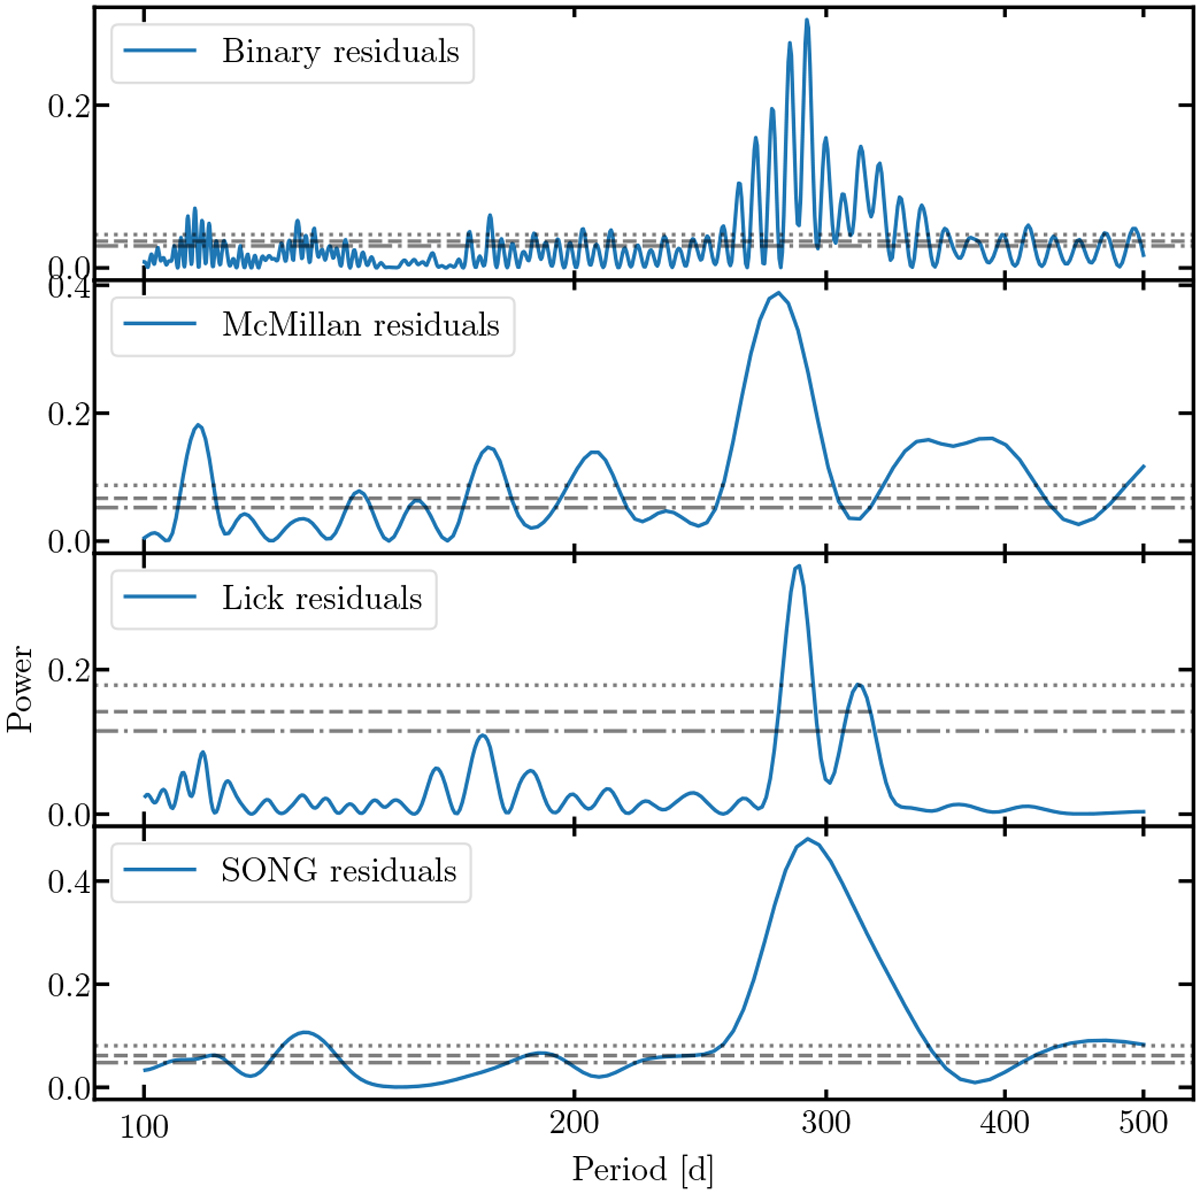
GLS periodograms of the residuals of the RV measurements after removal of the binary signal. The periodogram of the combined data sets (top panel) shows two peaks with similar heights at ~ 282.5 d and ~ 290.8 d. The gray dash-dotted, dashed and dotted lines represent false-alarm probability (FAP) levels of 5, 1 and 0.1%, respectively.
Current usage metrics show cumulative count of Article Views (full-text article views including HTML views, PDF and ePub downloads, according to the available data) and Abstracts Views on Vision4Press platform.
Data correspond to usage on the plateform after 2015. The current usage metrics is available 48-96 hours after online publication and is updated daily on week days.
Initial download of the metrics may take a while.