Fig. 10
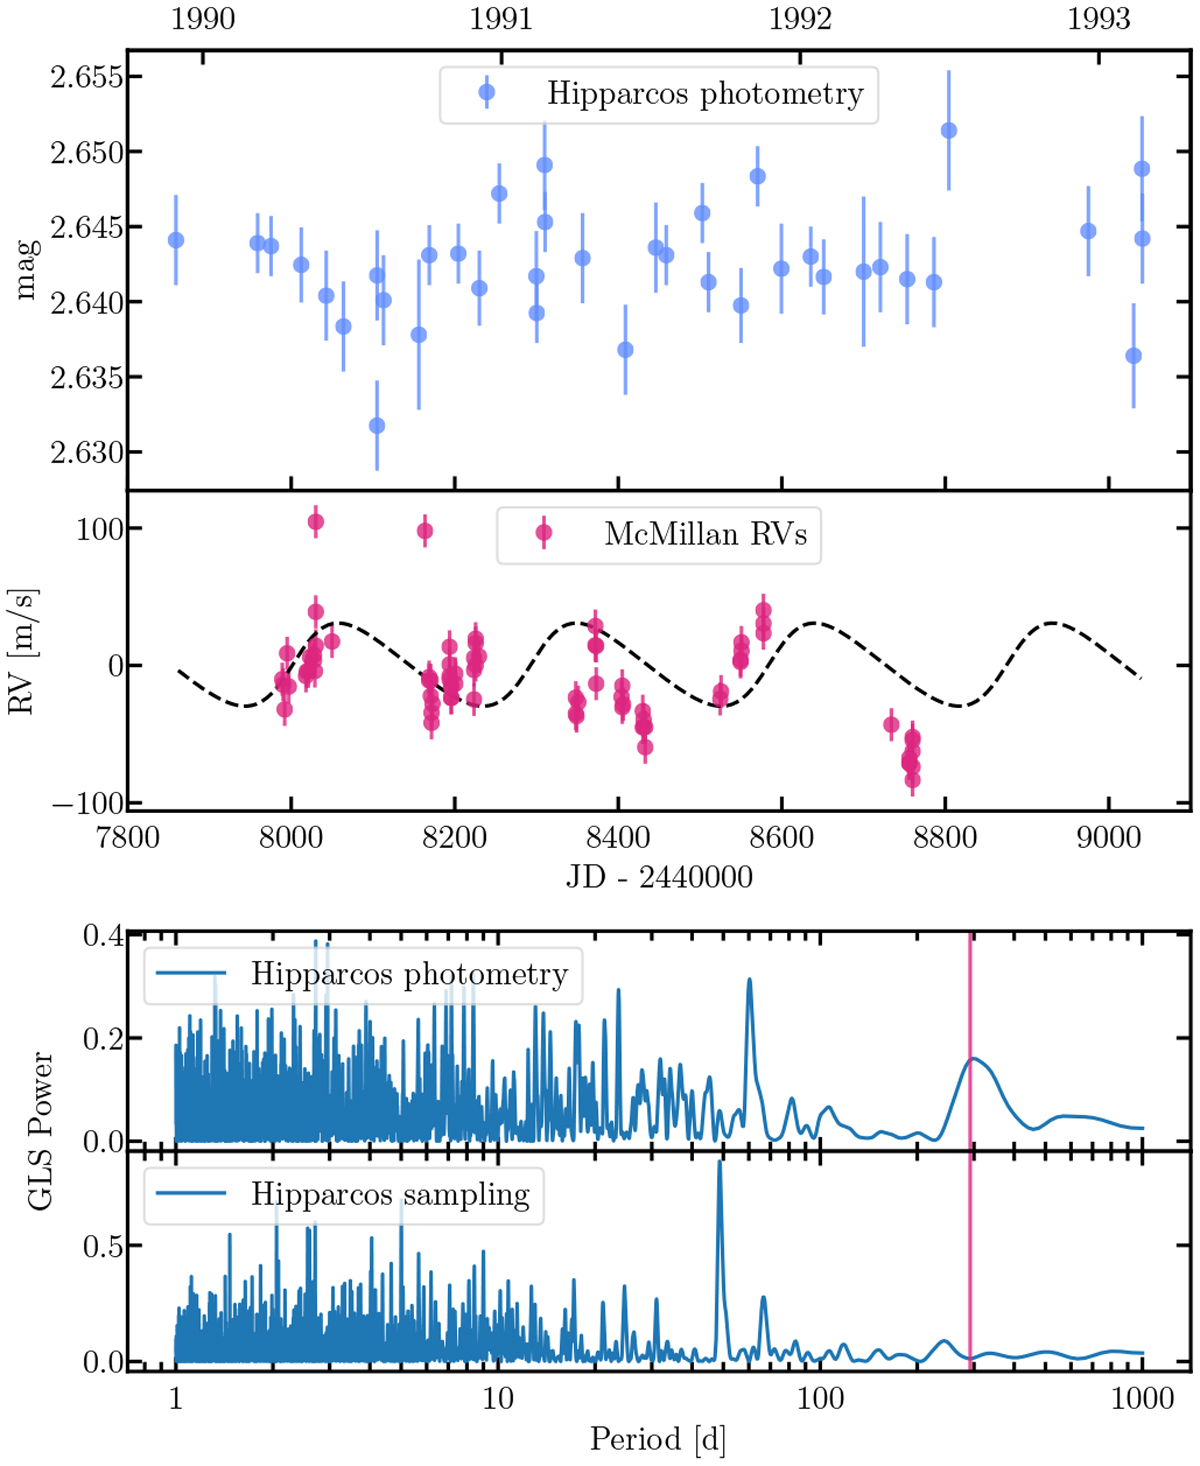
Top: HIPPARCOS photometry for ε Cyg, taken around the same time as the last RVs of the McMillan data set. The displayed photometry data are median values for all cases of multiple measurements within one day; the RVs are the residuals of the McMillan measurements after subtracting the long-period signal induced by the binary companion (see Sect. 4.1), and the dashed line denotes the best-fit model. Bottom: GLS periodogram of the HIPPARCOS photometry data and of the window function of the observations. The best-fit Keplerian orbital period of the signal of 291 d is marked with a red line.
Current usage metrics show cumulative count of Article Views (full-text article views including HTML views, PDF and ePub downloads, according to the available data) and Abstracts Views on Vision4Press platform.
Data correspond to usage on the plateform after 2015. The current usage metrics is available 48-96 hours after online publication and is updated daily on week days.
Initial download of the metrics may take a while.