Fig. 2.
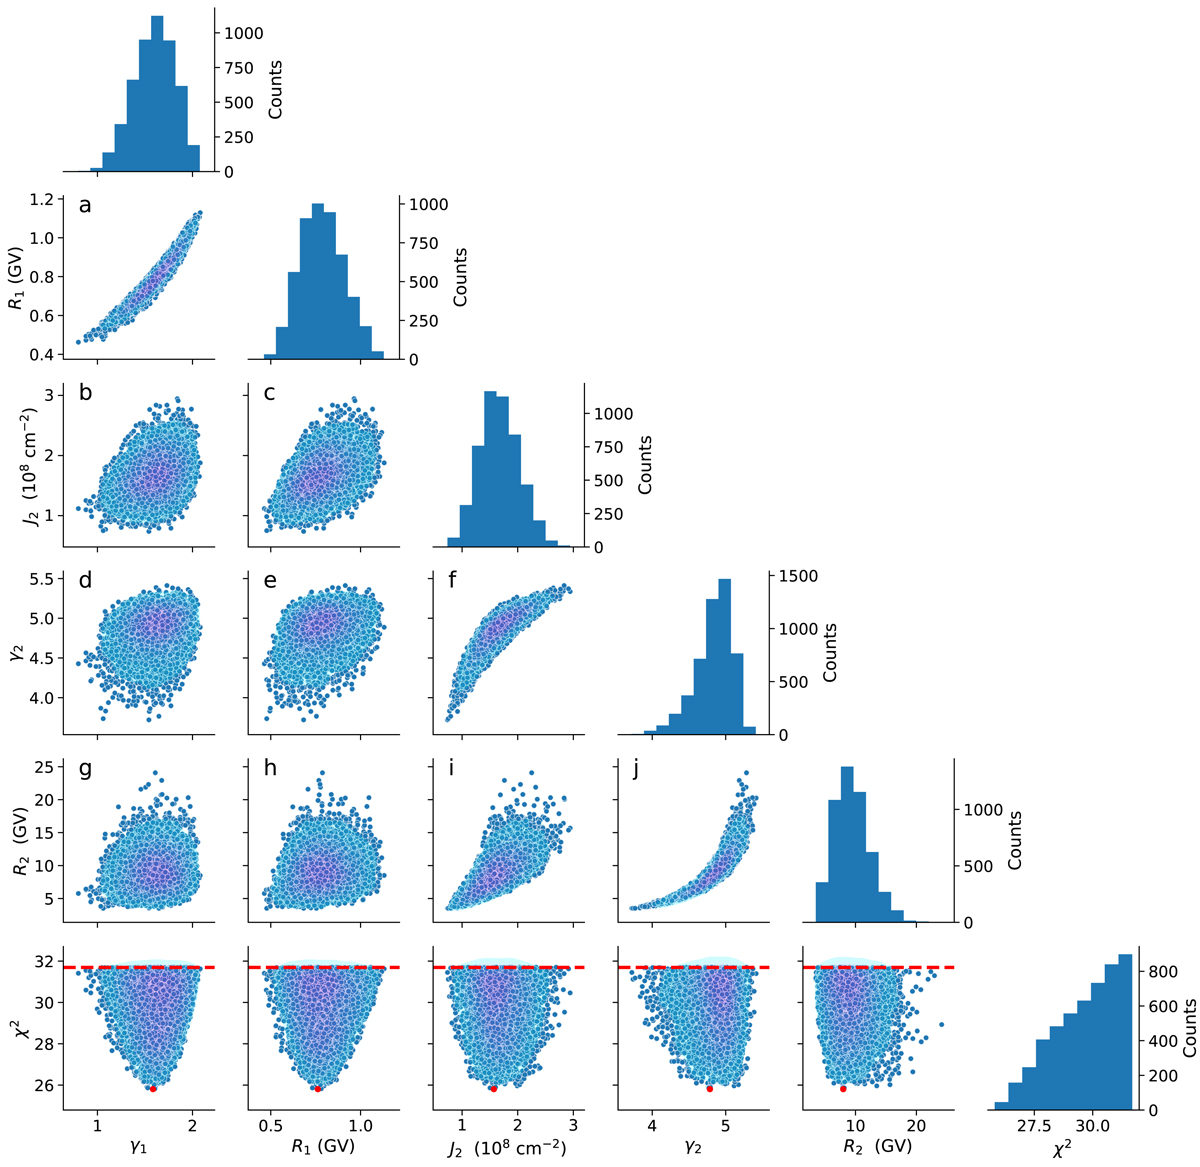
Distribution of the parameters and their pair-wise correlations for the MBF fitting of the GLE #5 obtained for 10 000 iterations (see Step 3 in Sect. 3). The red dots in the bottom panels correspond to the minimum ![]() , while the horizontal red dashed line
, while the horizontal red dashed line ![]() denotes the 68% confidence interval for the best-fit parameter values. Colour intensity corresponds to the point density. The diagonal panels depict histograms of the parameter values’ distribution.
denotes the 68% confidence interval for the best-fit parameter values. Colour intensity corresponds to the point density. The diagonal panels depict histograms of the parameter values’ distribution.
Current usage metrics show cumulative count of Article Views (full-text article views including HTML views, PDF and ePub downloads, according to the available data) and Abstracts Views on Vision4Press platform.
Data correspond to usage on the plateform after 2015. The current usage metrics is available 48-96 hours after online publication and is updated daily on week days.
Initial download of the metrics may take a while.