Fig. 1.
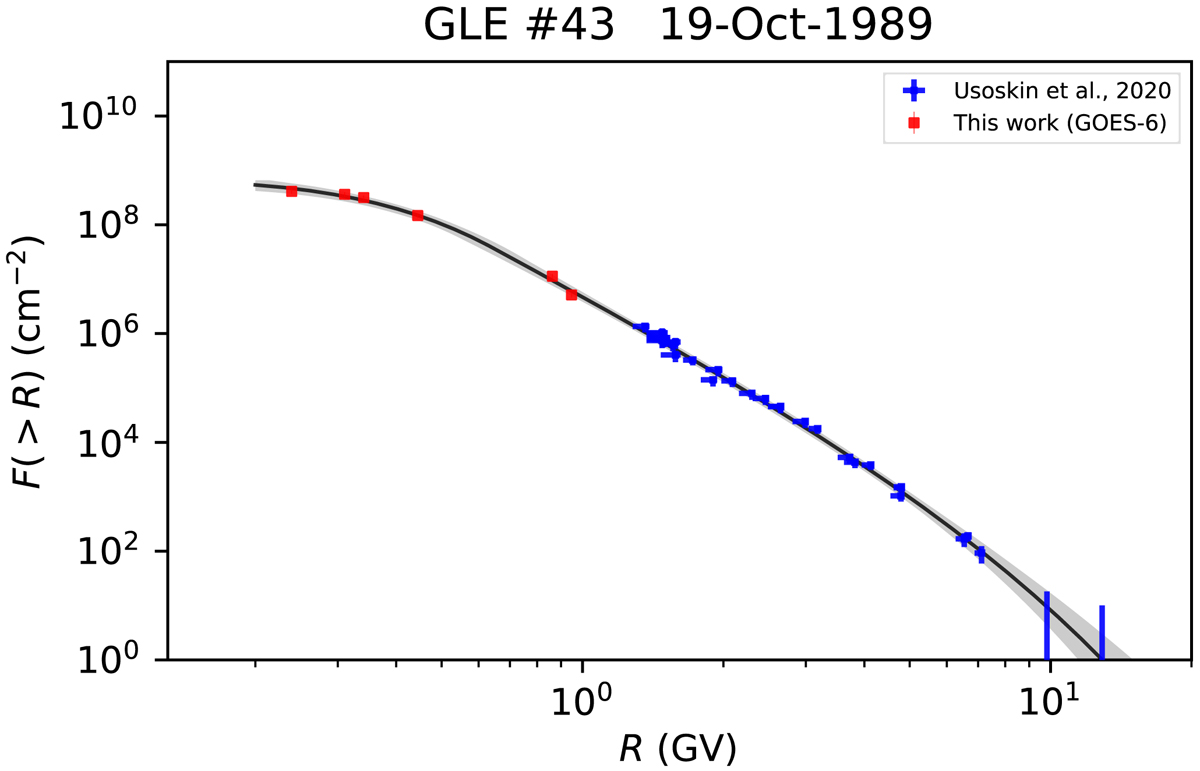
Example of the fitting of the modified Band function (Eqs. (1) and (2)) to the data points (Sect. 3) for GLE #43, 19-Oct-1989. Blue crosses and vertical lines denote the high-energy NM data with uncertainties, and the upper limits, respectively (Usoskin et al. 2020a), while red circles correspond to low-energy data from GOES-6 (see Table 1). The grey line with shading depicts the best-fit MBF, along with its 68% confidence interval.
Current usage metrics show cumulative count of Article Views (full-text article views including HTML views, PDF and ePub downloads, according to the available data) and Abstracts Views on Vision4Press platform.
Data correspond to usage on the plateform after 2015. The current usage metrics is available 48-96 hours after online publication and is updated daily on week days.
Initial download of the metrics may take a while.