Fig. 9.
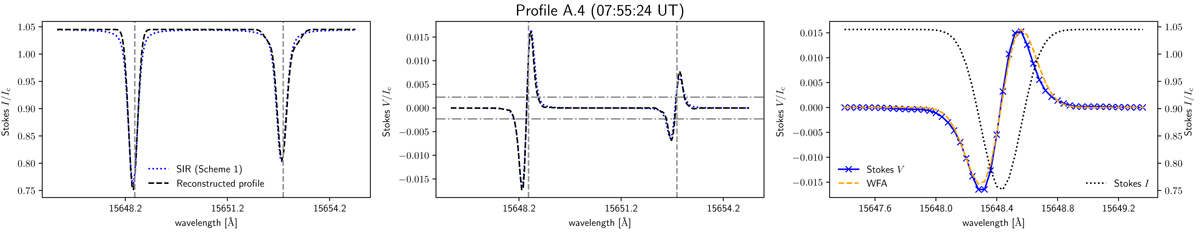
Example profile with its WFA estimate shown next to its the synthetic fit as returned from S1 inversions. Left and middle panels: reconstructed Stokes profiles (black, dashed line) from a pixel whose temporal and spatial location is indicated by the orange square outline in Fig. 8. Only Stokes V in this pixel had a maximum amplitude greater than σt. The blue, dotted line shows the minimum χ2 synthetic Stokes vector produced by SIR under S1 inversions. The horizontal (dot-dashed) lines show the σt noise threshold for the Stokes V, while the vertical (dashed) lines denote the rest wavelengths of each spectral line. The retrieved parameters were: B = 65 G, γ = 179°, α = 0.61, vLOS = −1.06 km s−1. Right panel: Stokes I (black, dotted line) and Stokes V (blue line with markers) profile over-plotted with the WFA fit obtained from the derivative of Stokes I (orange, dashed line).
Current usage metrics show cumulative count of Article Views (full-text article views including HTML views, PDF and ePub downloads, according to the available data) and Abstracts Views on Vision4Press platform.
Data correspond to usage on the plateform after 2015. The current usage metrics is available 48-96 hours after online publication and is updated daily on week days.
Initial download of the metrics may take a while.