Fig. 8.
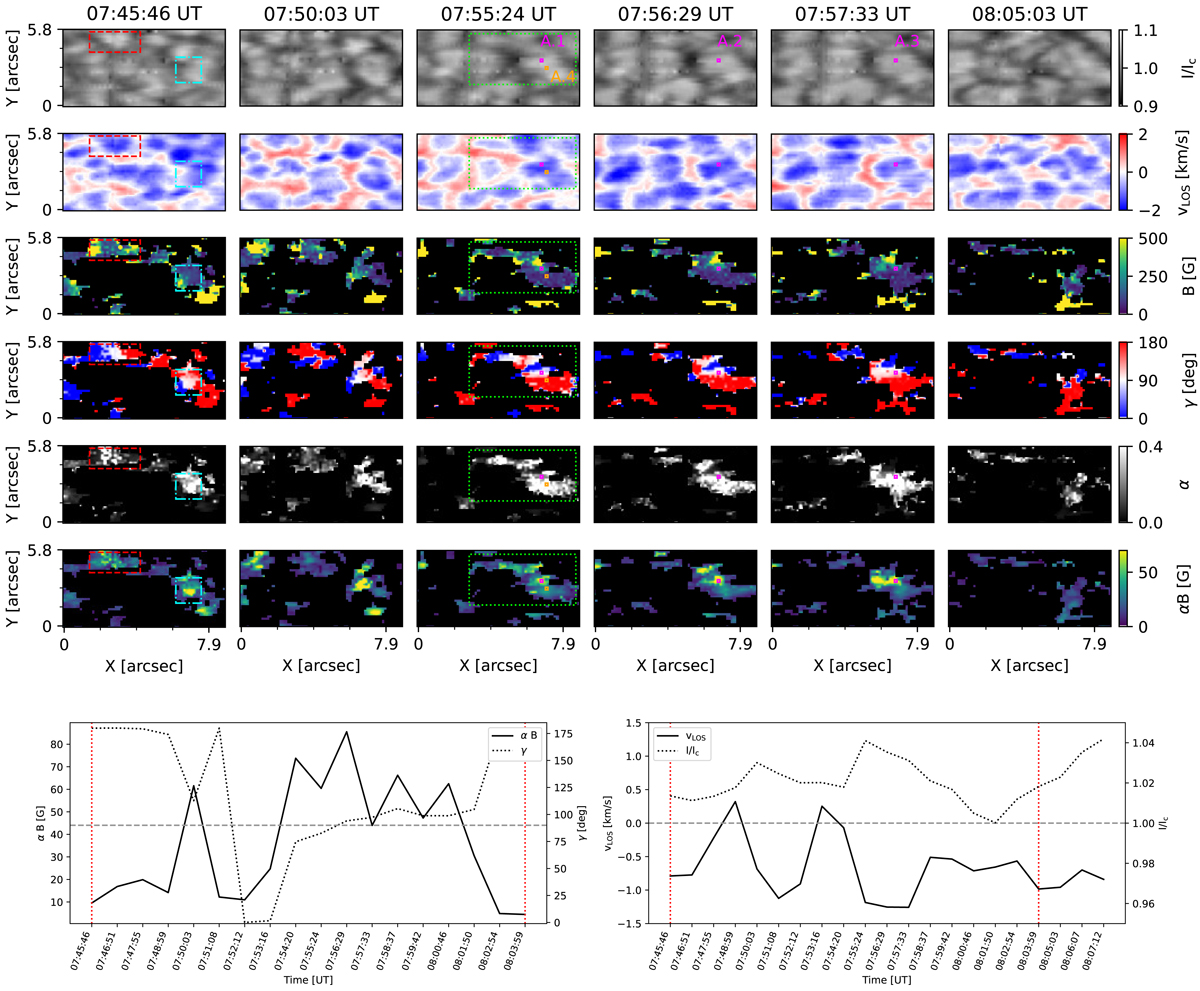
ROI A: a region with complex loop-like structures, observed in the 5 May scan, with clear opposite polarity longitudinal and transverse components present in every frame. Upper panels: first row showing the Stokes I normalized continuum, with subsequent rows showing, in descending order, as retrieved from S1 inversions: vLOS, B, γ, α, and αB. Maps of B saturate at 500 G so weaker fields are more easily visible. The columns show a selection of subsequent frames. Bottom panels: temporal evolution of the following quantities are shown for the pixel whose spatial and temporal location in ROI A is highlighted with a solid magenta square outline above (i.e. the pixels A.1–3): αB, γ (left) and vLOS, I/Ic (right) as derived from S1 inversions. The horizontal dashed, grey lines indicate the position of 90° on the left panel and 0 km s−1 on the right panel. The vertical dotted, red lines are a visual aid for the time-stamps of the start and end-point of the left panel.
Current usage metrics show cumulative count of Article Views (full-text article views including HTML views, PDF and ePub downloads, according to the available data) and Abstracts Views on Vision4Press platform.
Data correspond to usage on the plateform after 2015. The current usage metrics is available 48-96 hours after online publication and is updated daily on week days.
Initial download of the metrics may take a while.