Fig. 7.
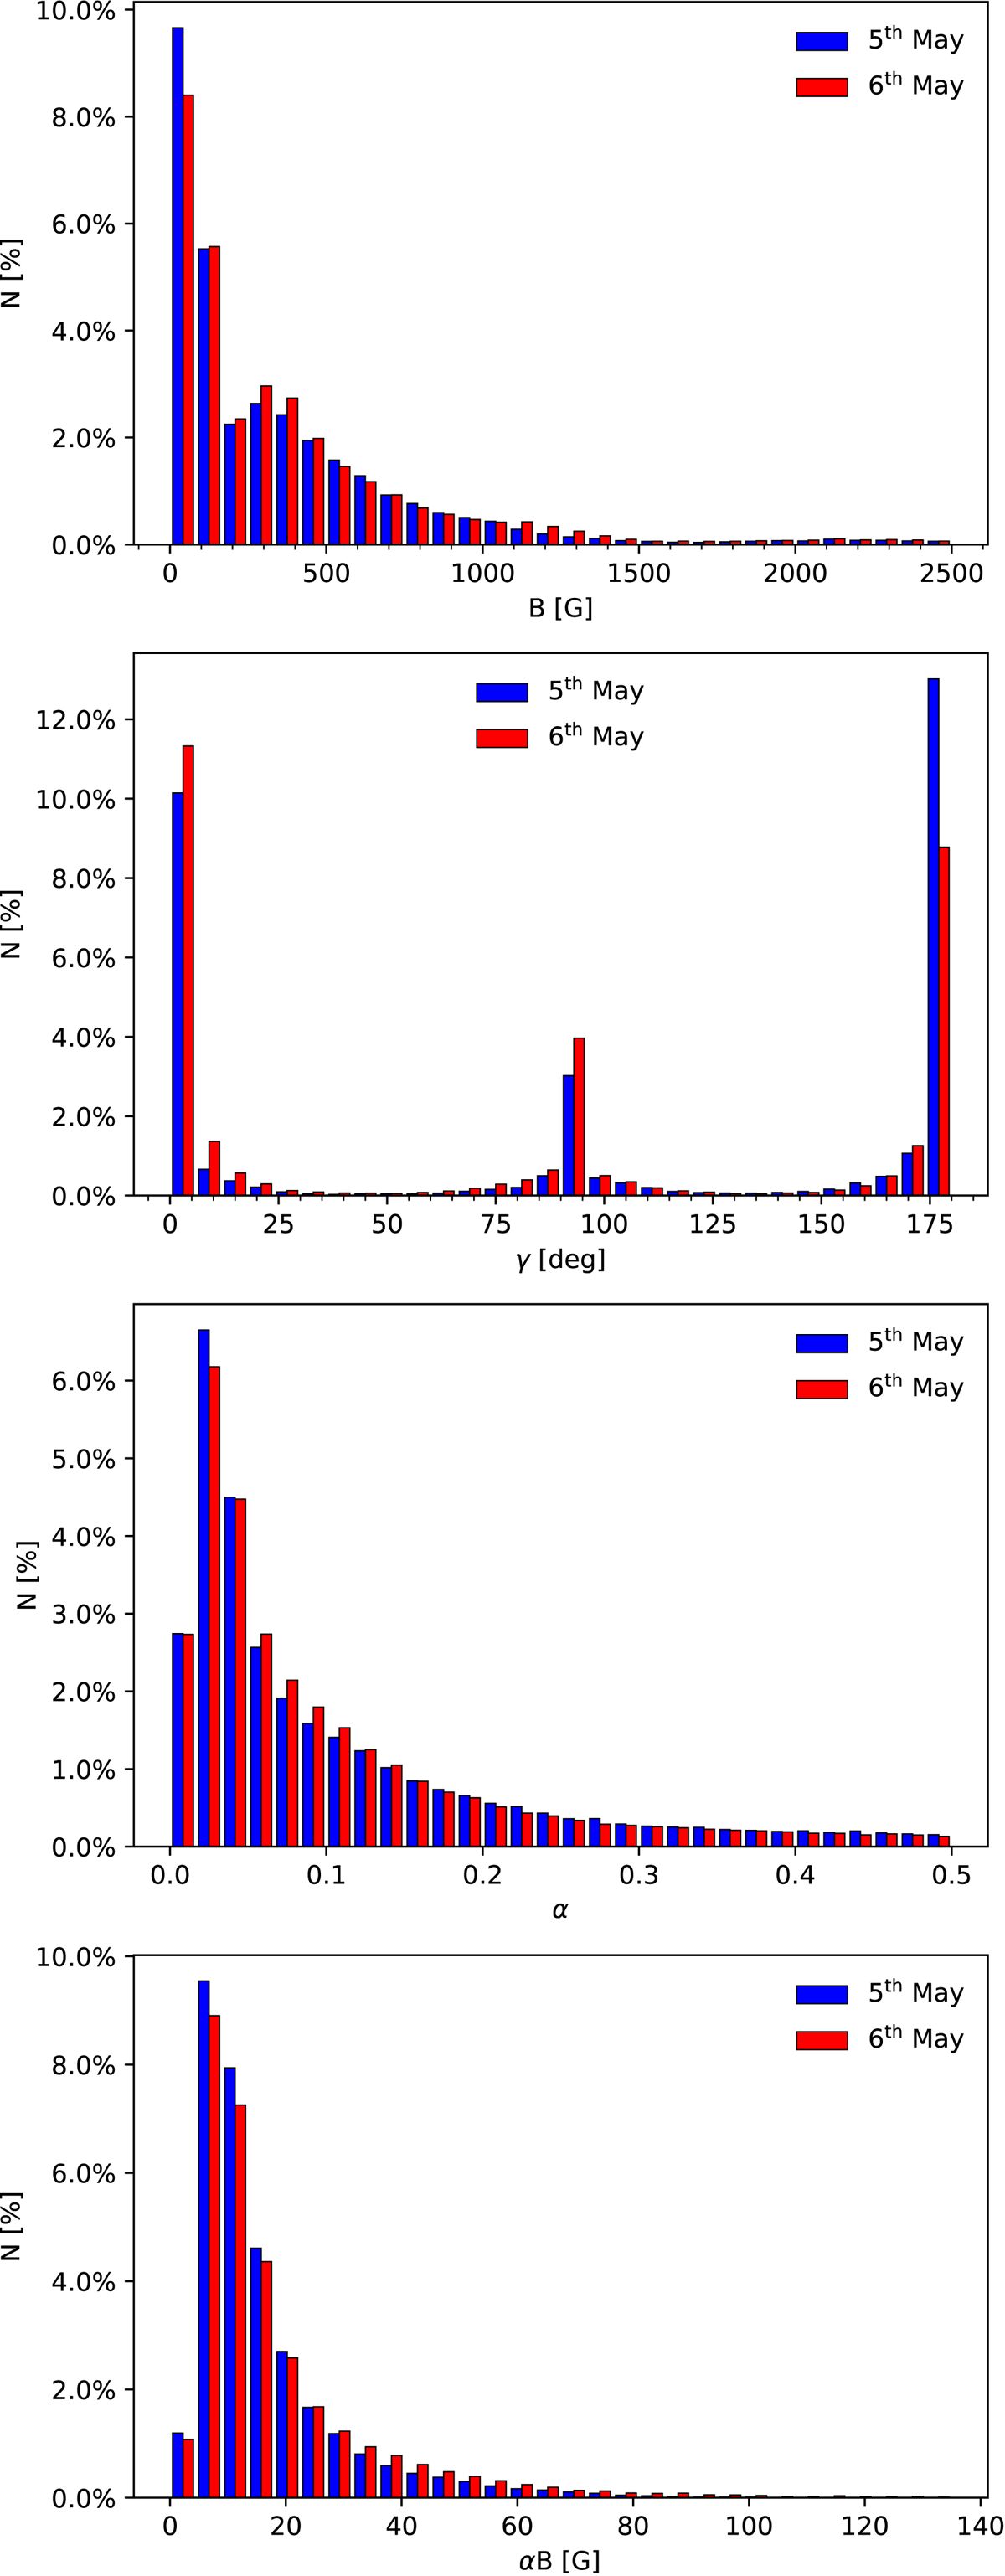
Histograms of B (top row), γ (second row), α (third row) and αB, (bottom row) returned from the inversions under S1. The histograms are shown for pixels with maximum amplitude in at least one Stokes vector σt. The blue and red columns show the distributions for the scans on the 5 and 6 May, respectively. The percentages in all histograms are weighted with respect to the total number of pixels, i.e. including those with no polarization.
Current usage metrics show cumulative count of Article Views (full-text article views including HTML views, PDF and ePub downloads, according to the available data) and Abstracts Views on Vision4Press platform.
Data correspond to usage on the plateform after 2015. The current usage metrics is available 48-96 hours after online publication and is updated daily on week days.
Initial download of the metrics may take a while.