Fig. 4.
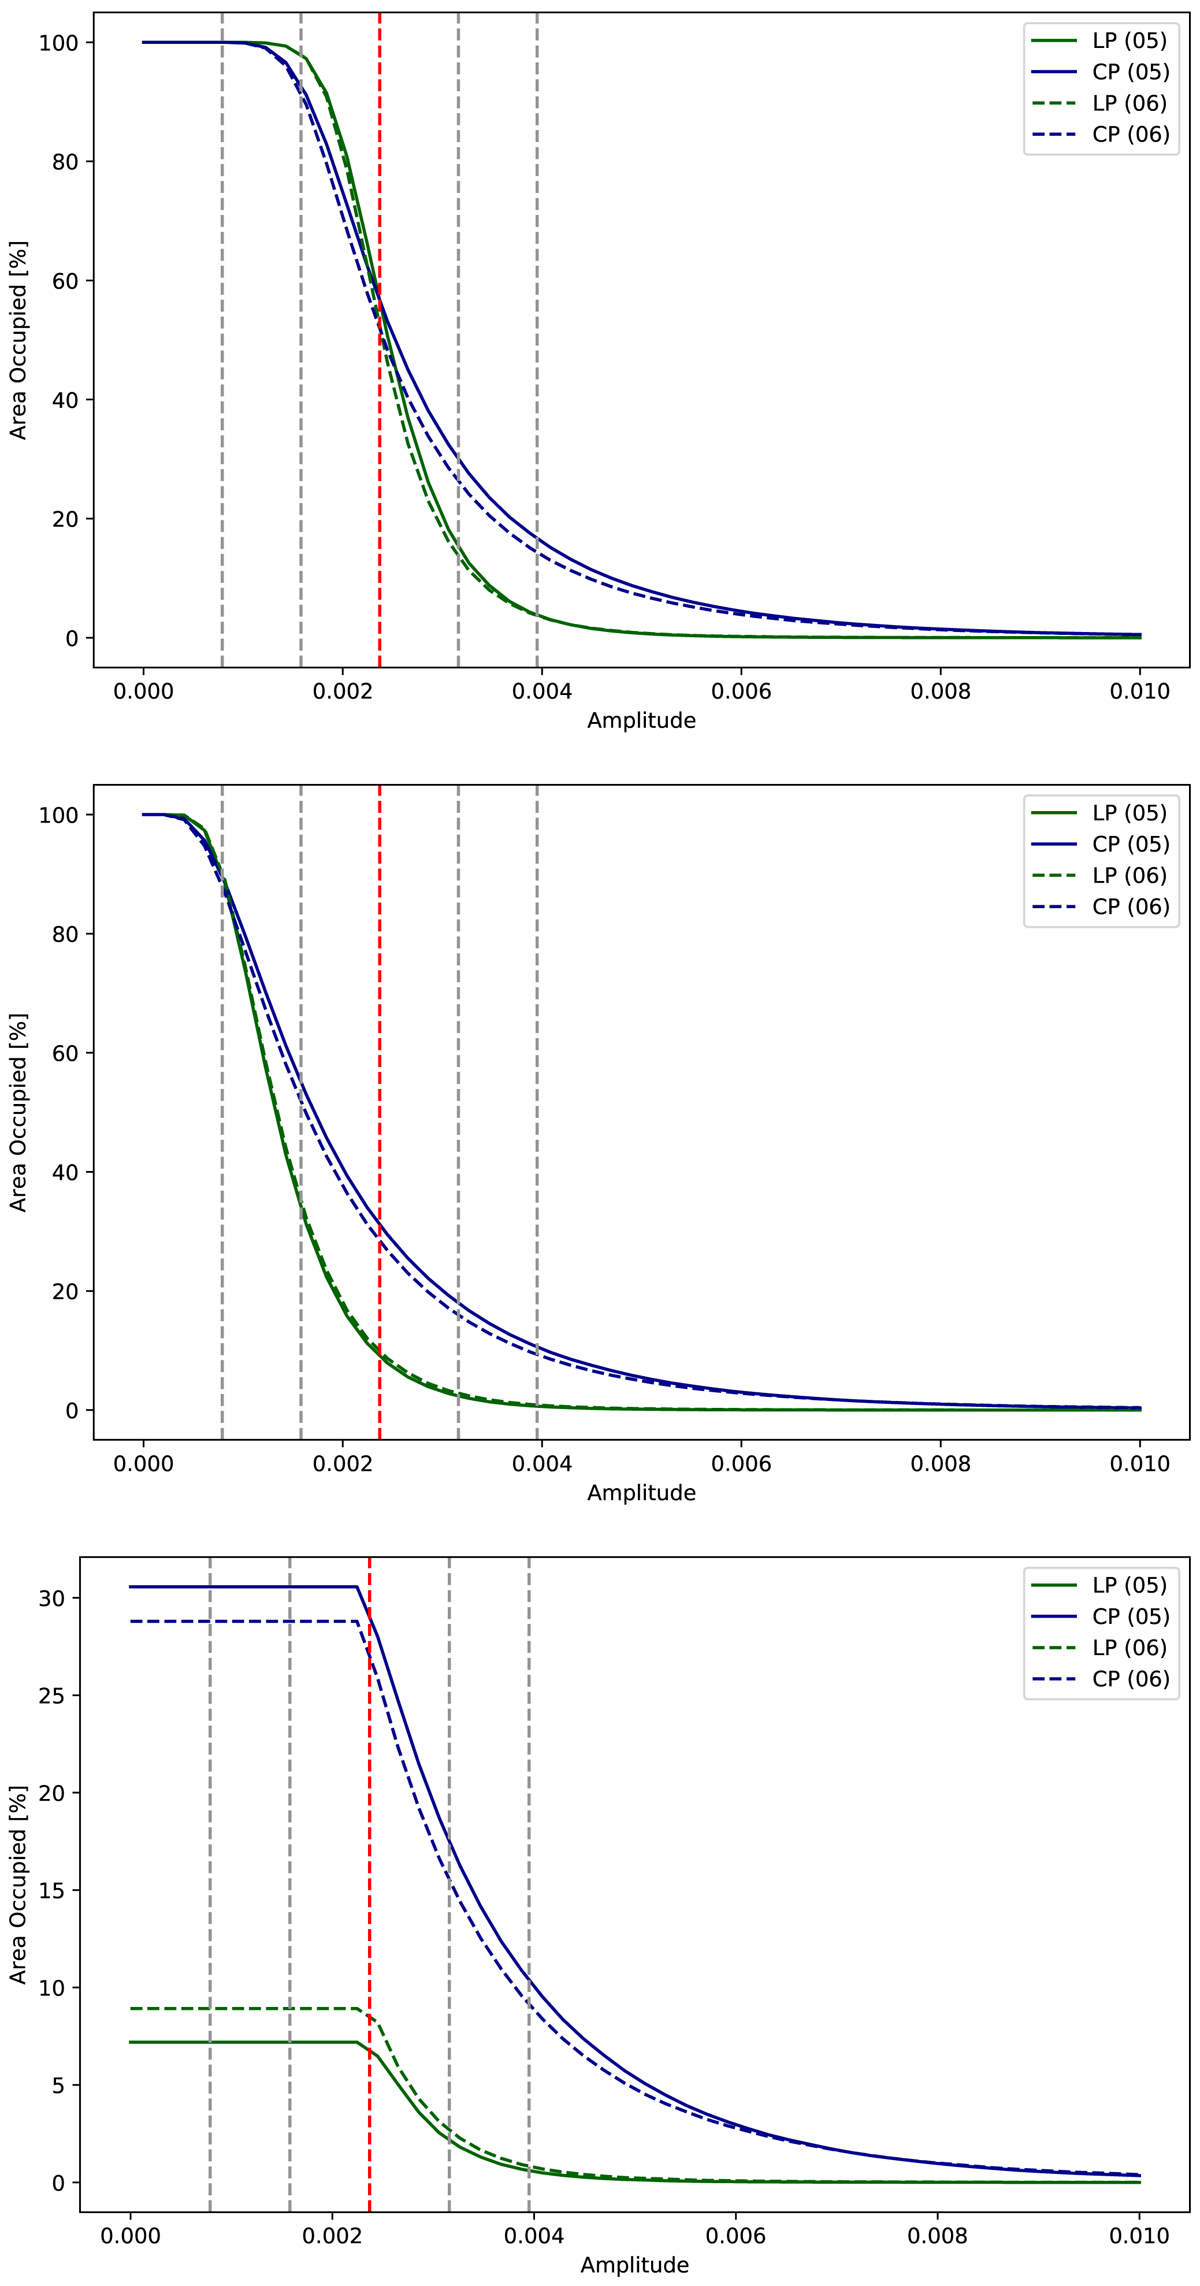
Total area occupied by pixels with maximum amplitude greater than given amplitudes for the scans on the 5 May (solid lines) and 6 May (dashed lines). A pixel has an LP above a given amplitude if its maximum Stokes Q or U value exceeds that amplitude across the 15648.52 Å line (green lines) and likewise for CP and Stokes V (blue lines). Upper: original level 1 data. Middle: data after PCA filtering. Lower: data after PCA filtering, reconstruction by the RVM and with any Stokes vector with maximum amplitude < σt (vertical, red, dashed line) set to zero. The vertical dashed lines indicate the 1, 2, 3, 4 and 5σ (left to right) levels averaged across all frames as measured in the original data. The σ level is averaged for all pixels in a given frame and is specific to a given Stokes vector.
Current usage metrics show cumulative count of Article Views (full-text article views including HTML views, PDF and ePub downloads, according to the available data) and Abstracts Views on Vision4Press platform.
Data correspond to usage on the plateform after 2015. The current usage metrics is available 48-96 hours after online publication and is updated daily on week days.
Initial download of the metrics may take a while.