Fig. A.1.
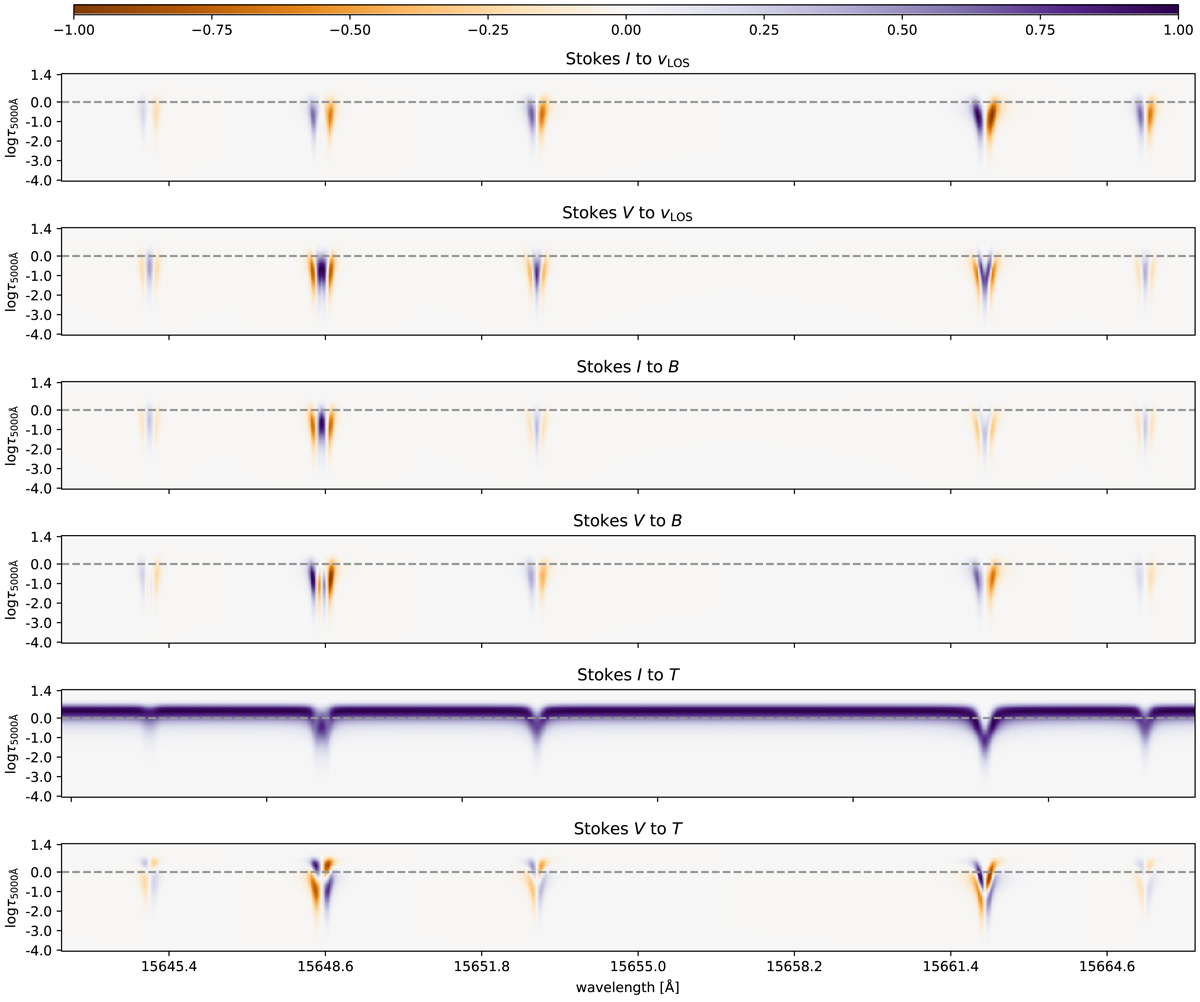
Response functions of Stokes I and V to vLOS, B and T in wavelength and optical depth, τ. Each response function is normalized with respect to the maximum absolute value. The dashed horizontal line emphasizes the location of log τ5000 Å = 0. These response functions were computed by SIR, using profiles produced in synthesis mode from a FALC model atmosphere with γ and ϕ fixed at 45°, B at 300 G and vLOS at 0 km s−1.
Current usage metrics show cumulative count of Article Views (full-text article views including HTML views, PDF and ePub downloads, according to the available data) and Abstracts Views on Vision4Press platform.
Data correspond to usage on the plateform after 2015. The current usage metrics is available 48-96 hours after online publication and is updated daily on week days.
Initial download of the metrics may take a while.