Fig. 10.
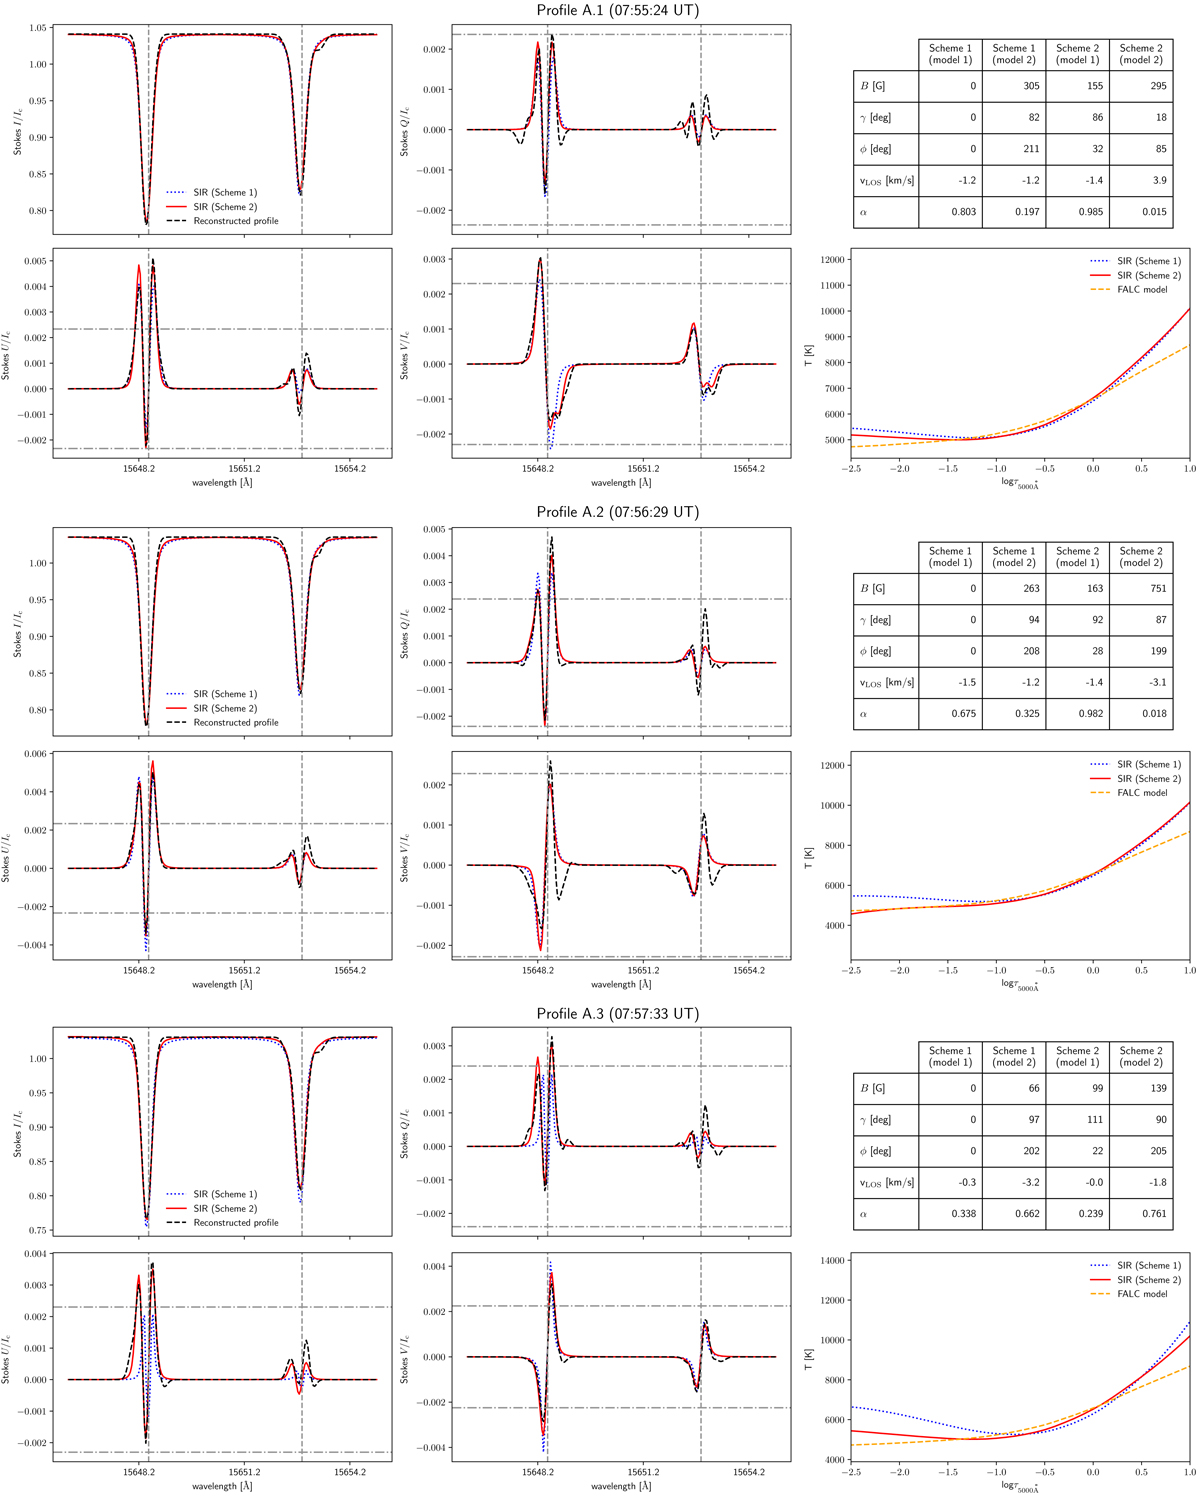
Reconstructed full Stokes vector is shown for the 15648.52/15652.87 Å line pair in the left four panels, along with the S1 and S2 synthetic profiles derived from the SIR inversions, for the pixel whose spatial location in ROI A is highlighted with magenta square outline in Fig. 8, for three frames. The horizontal (dot-dashed) lines show the σt noise thresholds for the polarized Stokes vectors, while the vertical (dashed) lines denote the rest wavelengths of each spectral line. On the right, the retrieved atmospheric parameters for each scheme is shown in the table, while the temperature as a function of optical depth is shown in the lower right plot with the original FALC input model.
Current usage metrics show cumulative count of Article Views (full-text article views including HTML views, PDF and ePub downloads, according to the available data) and Abstracts Views on Vision4Press platform.
Data correspond to usage on the plateform after 2015. The current usage metrics is available 48-96 hours after online publication and is updated daily on week days.
Initial download of the metrics may take a while.