Fig. A.4.
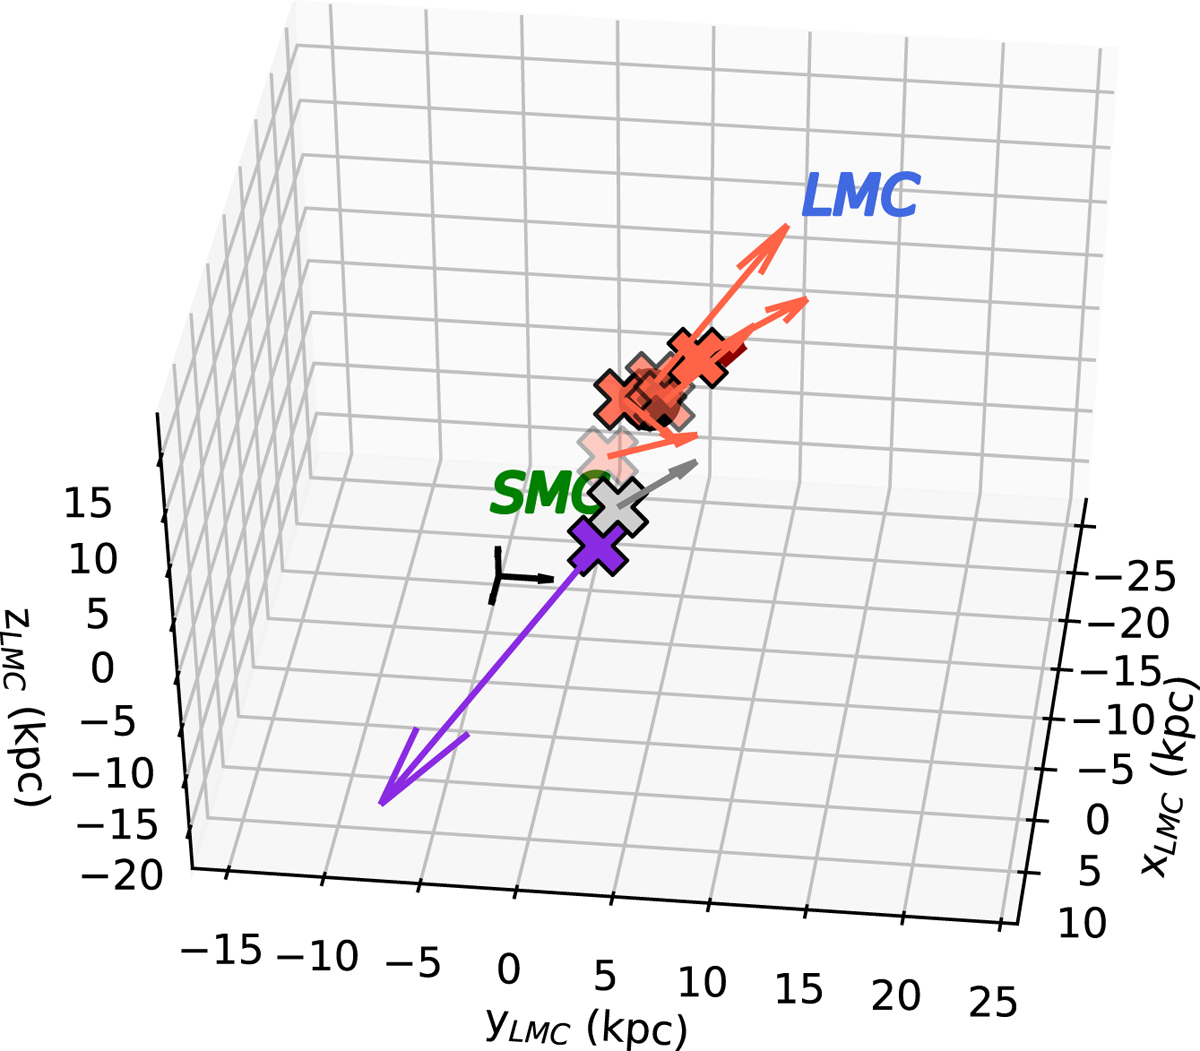
Phase-space vectors of the seven clusters analysed in this work in a 3D Cartesian system centred at the SMC as described in the text. Arrows are the velocities relative to the SMC mean velocity. Colours and symbols are the same as in Fig. 2. The average velocity of the five Bridge clusters is shown in dark red. The black arrows are a reference scale representing 10 km s−1. A movie is available online.
Current usage metrics show cumulative count of Article Views (full-text article views including HTML views, PDF and ePub downloads, according to the available data) and Abstracts Views on Vision4Press platform.
Data correspond to usage on the plateform after 2015. The current usage metrics is available 48-96 hours after online publication and is updated daily on week days.
Initial download of the metrics may take a while.