Fig. A.3.
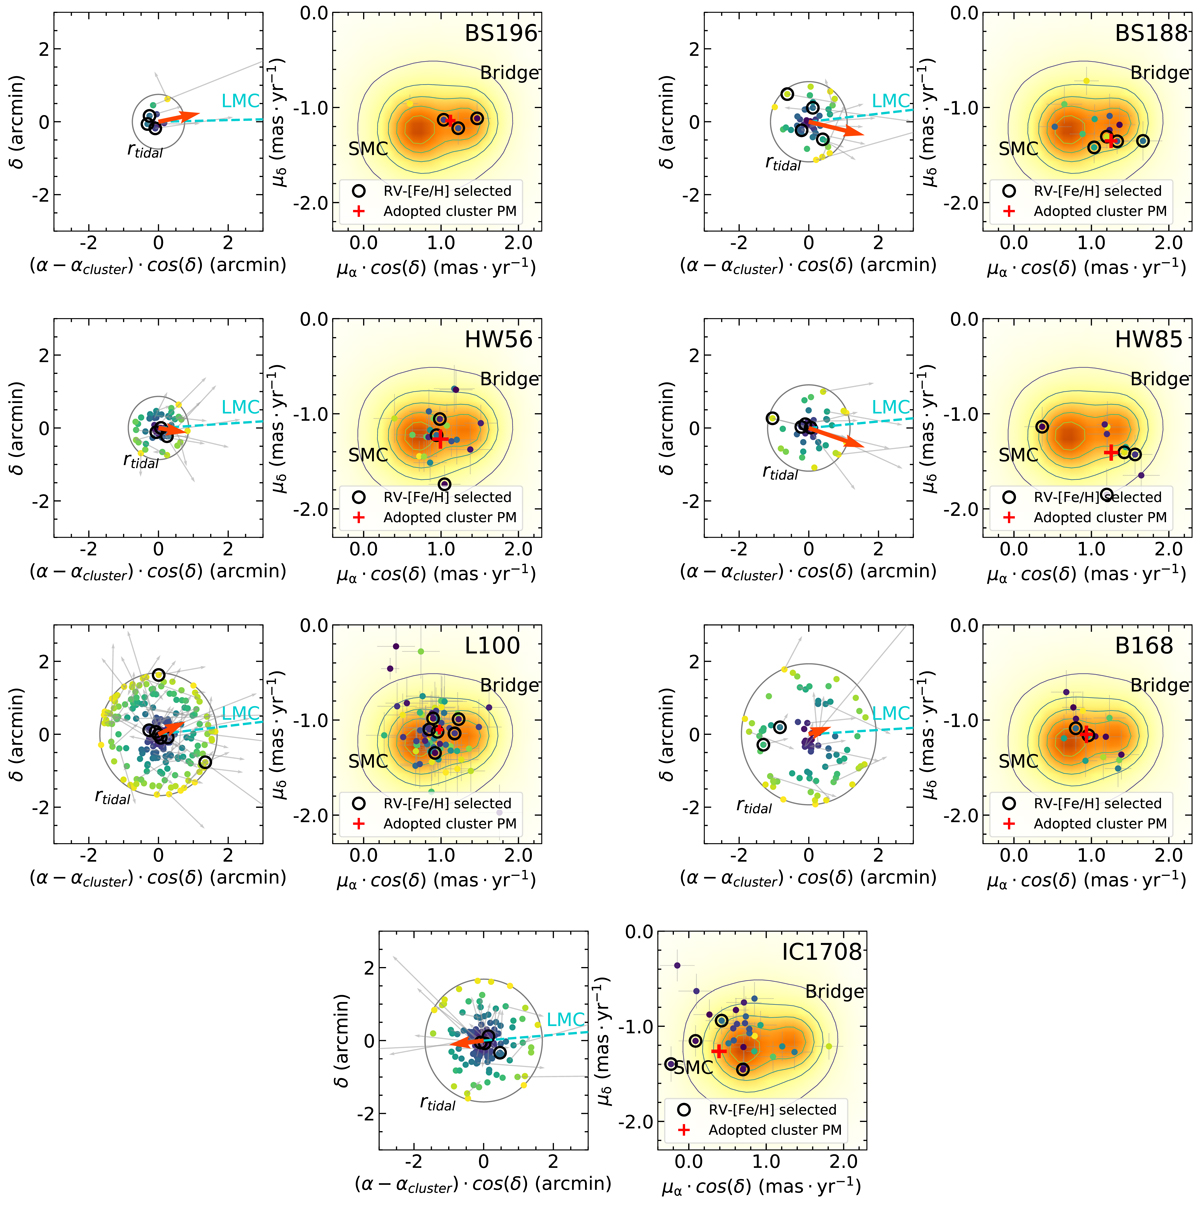
Vector-point diagram from Gaia EDR3 proper motions for the seven clusters. Left panel: on sky distribution of all Gaia stars within the tidal radius of the cluster. Colours indicate the distance from the cluster centre. Grey arrows are Gaia EDR3 good-quality proper motions subtracted from the SMC mean proper motion. The red thick arrow is the average of the selected member stars highlighted with black circles. The direction of the LMC is indicated by the turquoise line. Right panel: the background density plot represents the locus of the SMC and Bridge based on a sample of stars (see text for details). The points and their error bars are the equivalent from the left panel.
Current usage metrics show cumulative count of Article Views (full-text article views including HTML views, PDF and ePub downloads, according to the available data) and Abstracts Views on Vision4Press platform.
Data correspond to usage on the plateform after 2015. The current usage metrics is available 48-96 hours after online publication and is updated daily on week days.
Initial download of the metrics may take a while.