Fig. 1.
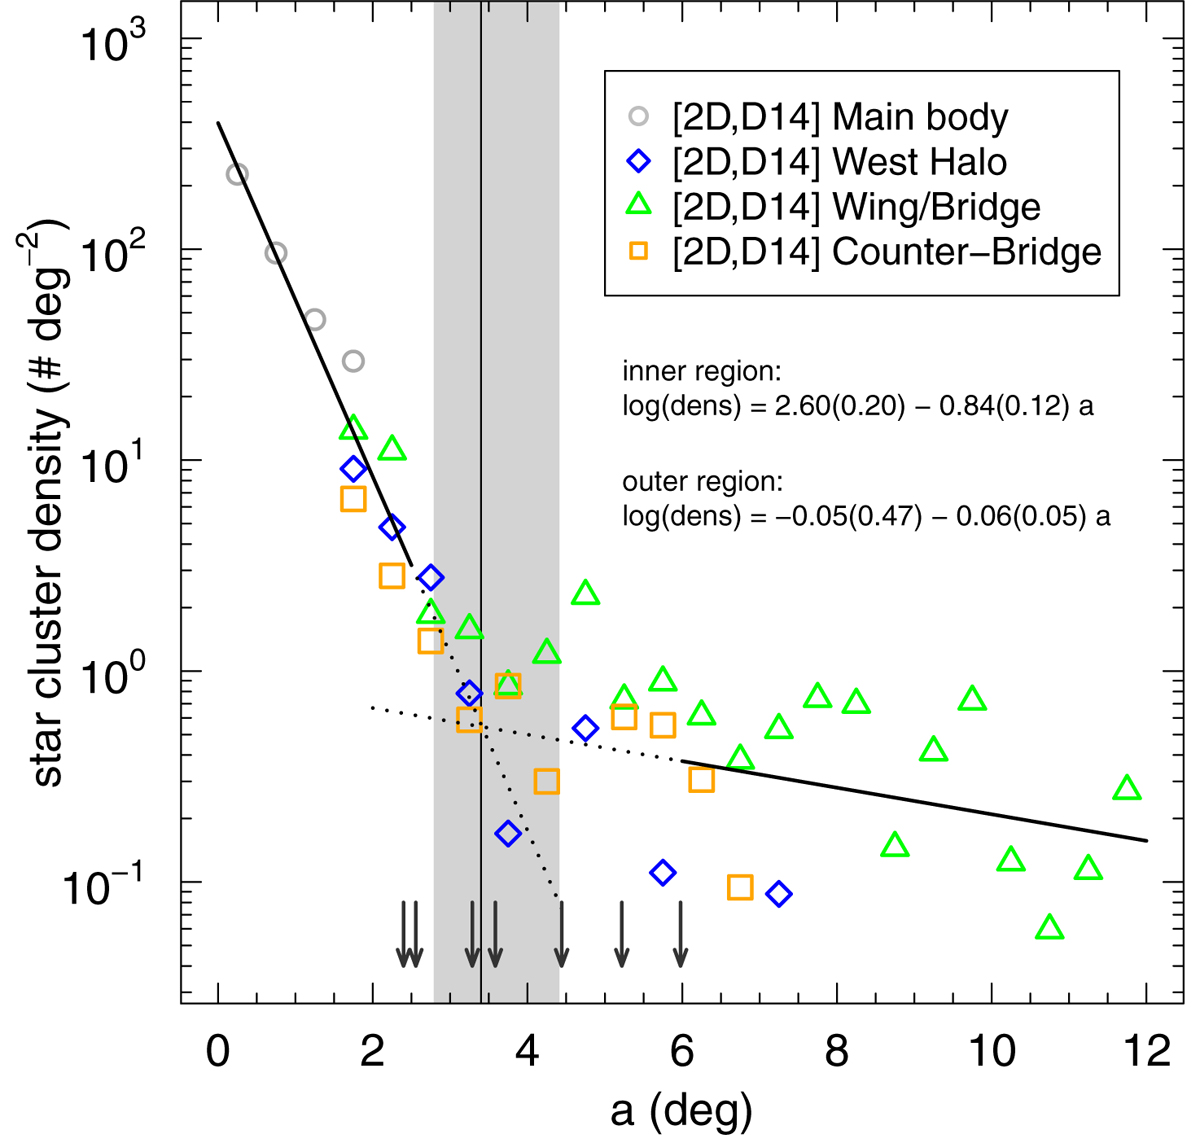
SMC star cluster radial density profile (catalogued by Bica et al. 2020), using the semi-major axis a of ellipses drawn around the SMC centre as defined by D14 (see also Fig. 2), with 0.5° bins. Solid lines are the fits to each region, whereas the dotted lines are extrapolation to find the intersection at ![]() , represented by the shaded grey 1σ area. The arrows indicate the position of the seven clusters.
, represented by the shaded grey 1σ area. The arrows indicate the position of the seven clusters.
Current usage metrics show cumulative count of Article Views (full-text article views including HTML views, PDF and ePub downloads, according to the available data) and Abstracts Views on Vision4Press platform.
Data correspond to usage on the plateform after 2015. The current usage metrics is available 48-96 hours after online publication and is updated daily on week days.
Initial download of the metrics may take a while.