Fig. 3.
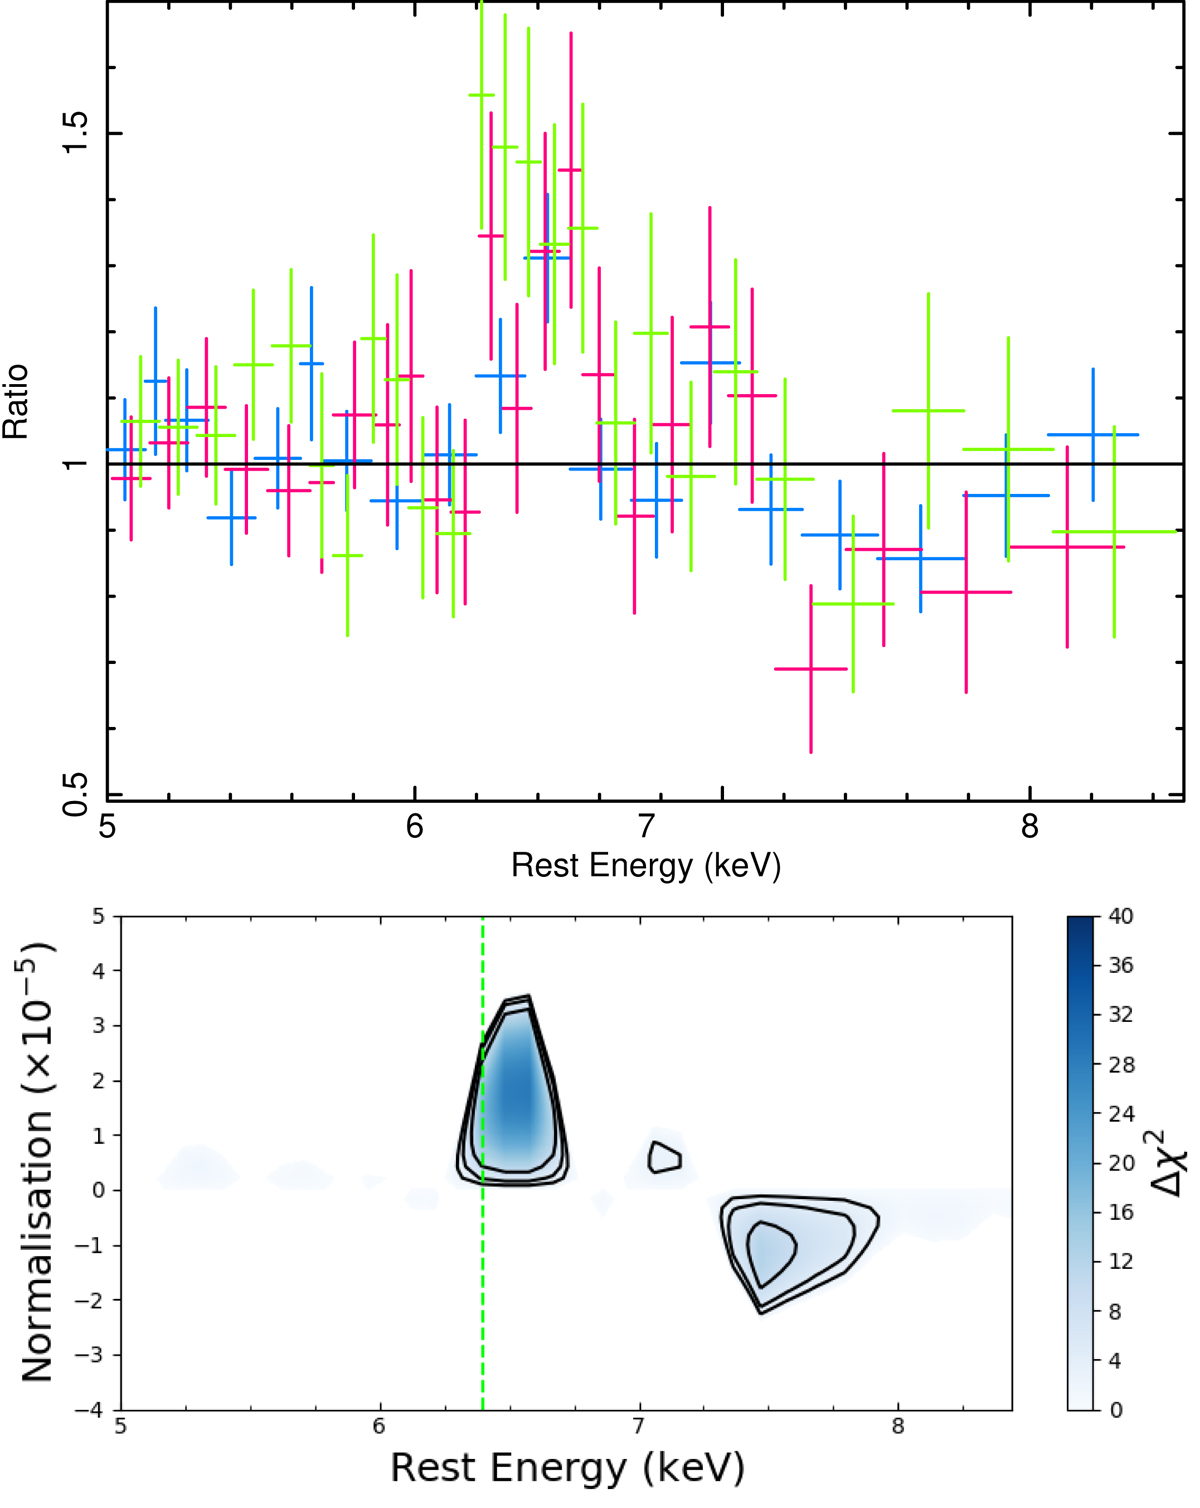
Top panel: ratio of the EPIC spectra in the 5–8.5 keV energy range with respect to an absorbed power law. All the instruments (pn in blue, MOS1 in magenta, and MOS2 in green) detected the Fe Kα and found a trough at about 7.5 keV. Bottom panel: blind line scan result between the normalisation and line energy, adopted on the pn-MOS spectra, where a Gaussian is left free to vary in the 5–8.5 keV energy range. The colour bar on the right indicates the significance of the lines for 2 degrees of freedom and the solid black contours correspond to 68%, 90%, and 99%.
Current usage metrics show cumulative count of Article Views (full-text article views including HTML views, PDF and ePub downloads, according to the available data) and Abstracts Views on Vision4Press platform.
Data correspond to usage on the plateform after 2015. The current usage metrics is available 48-96 hours after online publication and is updated daily on week days.
Initial download of the metrics may take a while.