Fig. 2.
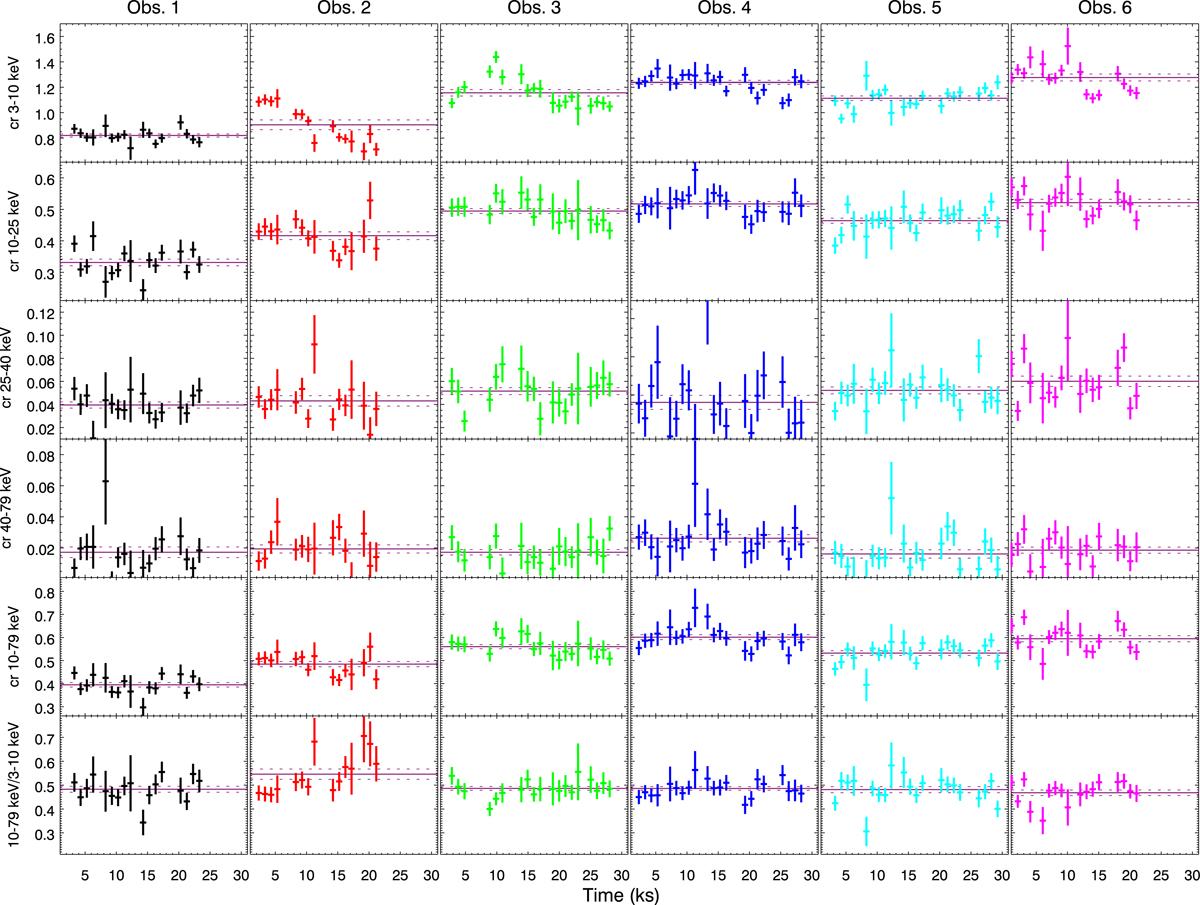
Background subtracted NuSTAR light curves of MCG-01-24-12 calculated with a temporal bin of 1000 s. Light curves account for co-added module A and B, and the various energy bands are labelled on the y-axis. For each observation a specific colour is used; this colour-coding is adopted throughout the whole paper. The horizontal straight lines are used to quantify the average count rate within each observation for the different bands, while dashed lines account for 1σ uncertainties around the mean.
Current usage metrics show cumulative count of Article Views (full-text article views including HTML views, PDF and ePub downloads, according to the available data) and Abstracts Views on Vision4Press platform.
Data correspond to usage on the plateform after 2015. The current usage metrics is available 48-96 hours after online publication and is updated daily on week days.
Initial download of the metrics may take a while.