Fig. 8.
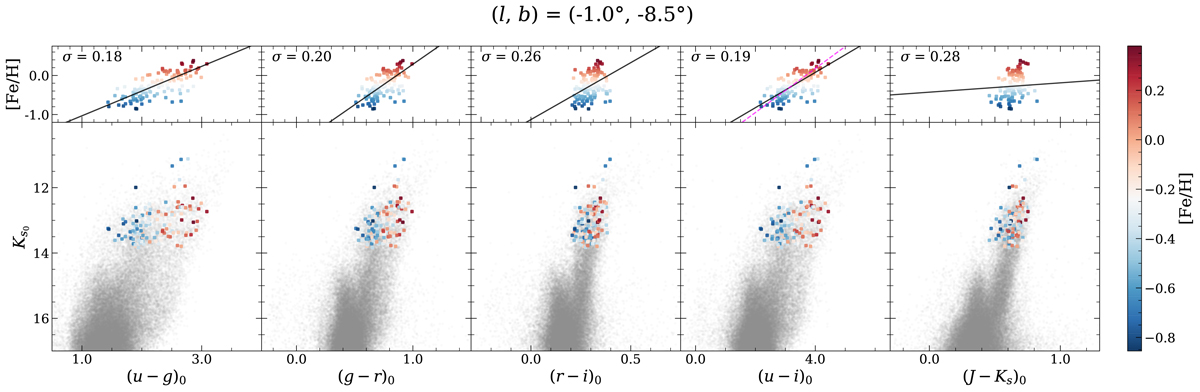
Color–magnitude diagrams for stars in the field at (l, b) = (−1.0°, −8.5°) together with [Fe/H] abundances of stars obtained from spectroscopy (data from Lim et al. 2021). The colored circles indicate the metallicity of stars from metal-poor (blue) to metal-rich (red). The [Fe/H] abundances of stars are clearly enhanced with increasing color. In particular, the metallicity gradient is apparent in the (u − g)0, (g − r)0, and (u − i)0 colors, but is indistinct in (r − i)0 and (J − Ks)0. Upper panels: color–metallicity relations (solid black lines) obtained from stars in 12.0 ≤ Ks0 ≤ 14.0. The standard deviation (σ) of the offset between the observed and fitted [Fe/H] values is indicated in the upper left corner. The [Fe/H] of stars is tightly correlated with (u − g)0, (g − r)0, and (u − i)0 colors with a small standard deviation. We note that the dashed magenta line in the (u − i)0 color represents the color–metallicity relation calculated in Johnson et al. (2020).
Current usage metrics show cumulative count of Article Views (full-text article views including HTML views, PDF and ePub downloads, according to the available data) and Abstracts Views on Vision4Press platform.
Data correspond to usage on the plateform after 2015. The current usage metrics is available 48-96 hours after online publication and is updated daily on week days.
Initial download of the metrics may take a while.