Fig. 2.
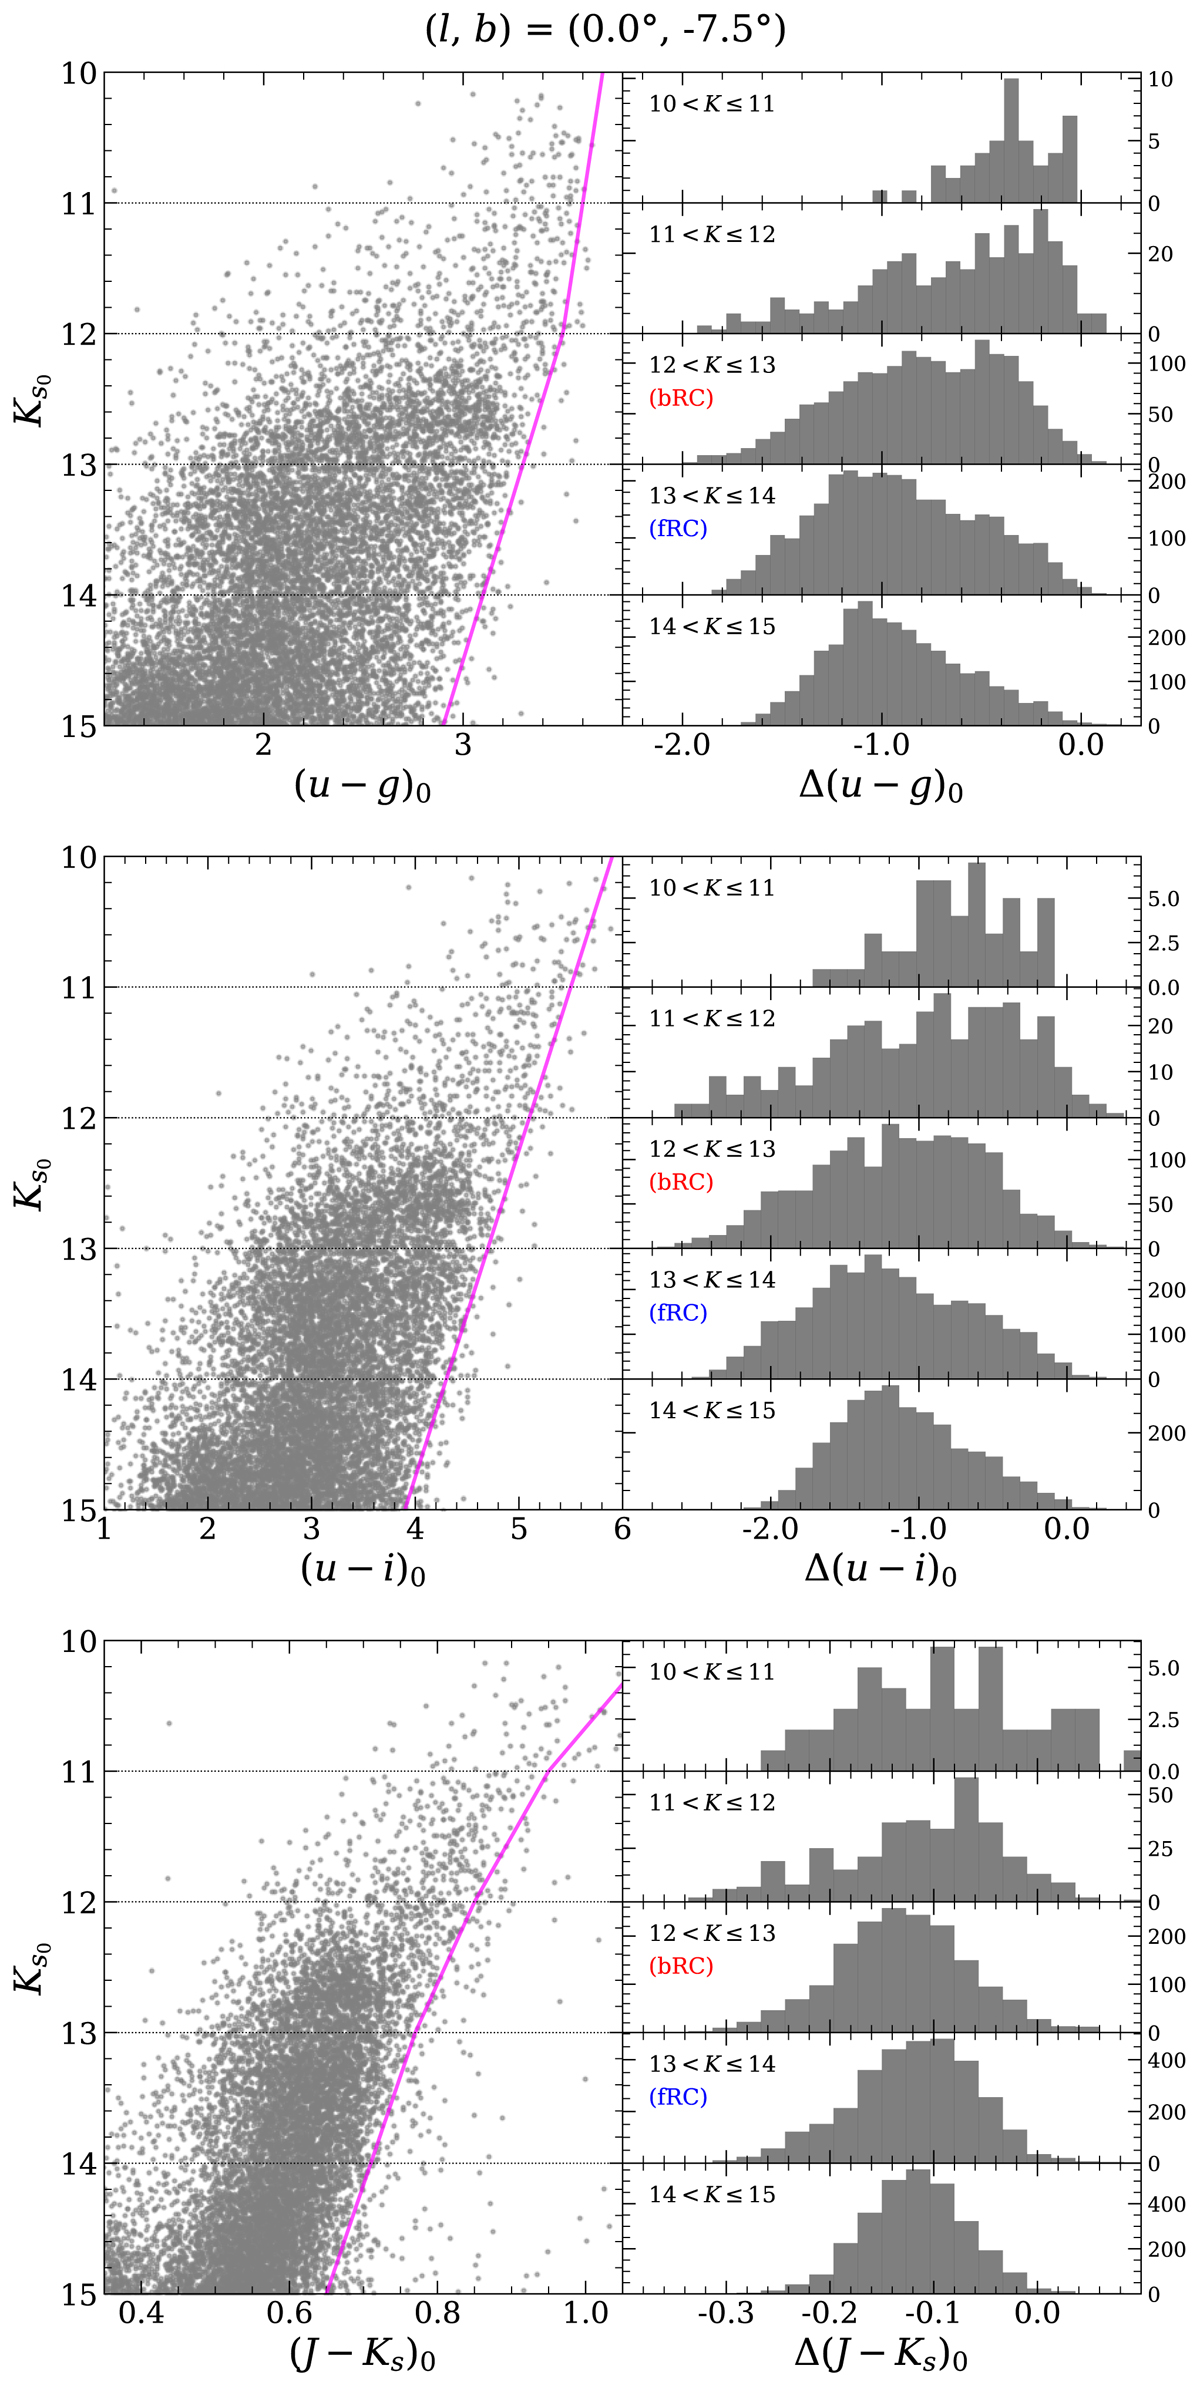
Color–magnitude diagrams and histograms of Δ(u − g)0, Δ(u − i)0, and Δ(J − Ks)0 for stars in the field of (l, b) = (0.0°, −7.5°). The Δ-colors are derived as the difference between the original color and the fiducial line (purple lines in the left panels), and the histogram is respectively drawn for stars within the 1.0 mag range from 10.0 to 15.0 mag in Ks0-band. Both the bRC and fRC stars show bimodal distributions in Δ(u − g)0 and Δ(u − i)0. However, the majority of the bRC is in the redder side, whereas that of the fRC is in the bluer side. In contrast, the bRC and fRC show similar distributions in the Δ(J − Ks)0.
Current usage metrics show cumulative count of Article Views (full-text article views including HTML views, PDF and ePub downloads, according to the available data) and Abstracts Views on Vision4Press platform.
Data correspond to usage on the plateform after 2015. The current usage metrics is available 48-96 hours after online publication and is updated daily on week days.
Initial download of the metrics may take a while.