Fig. 11.
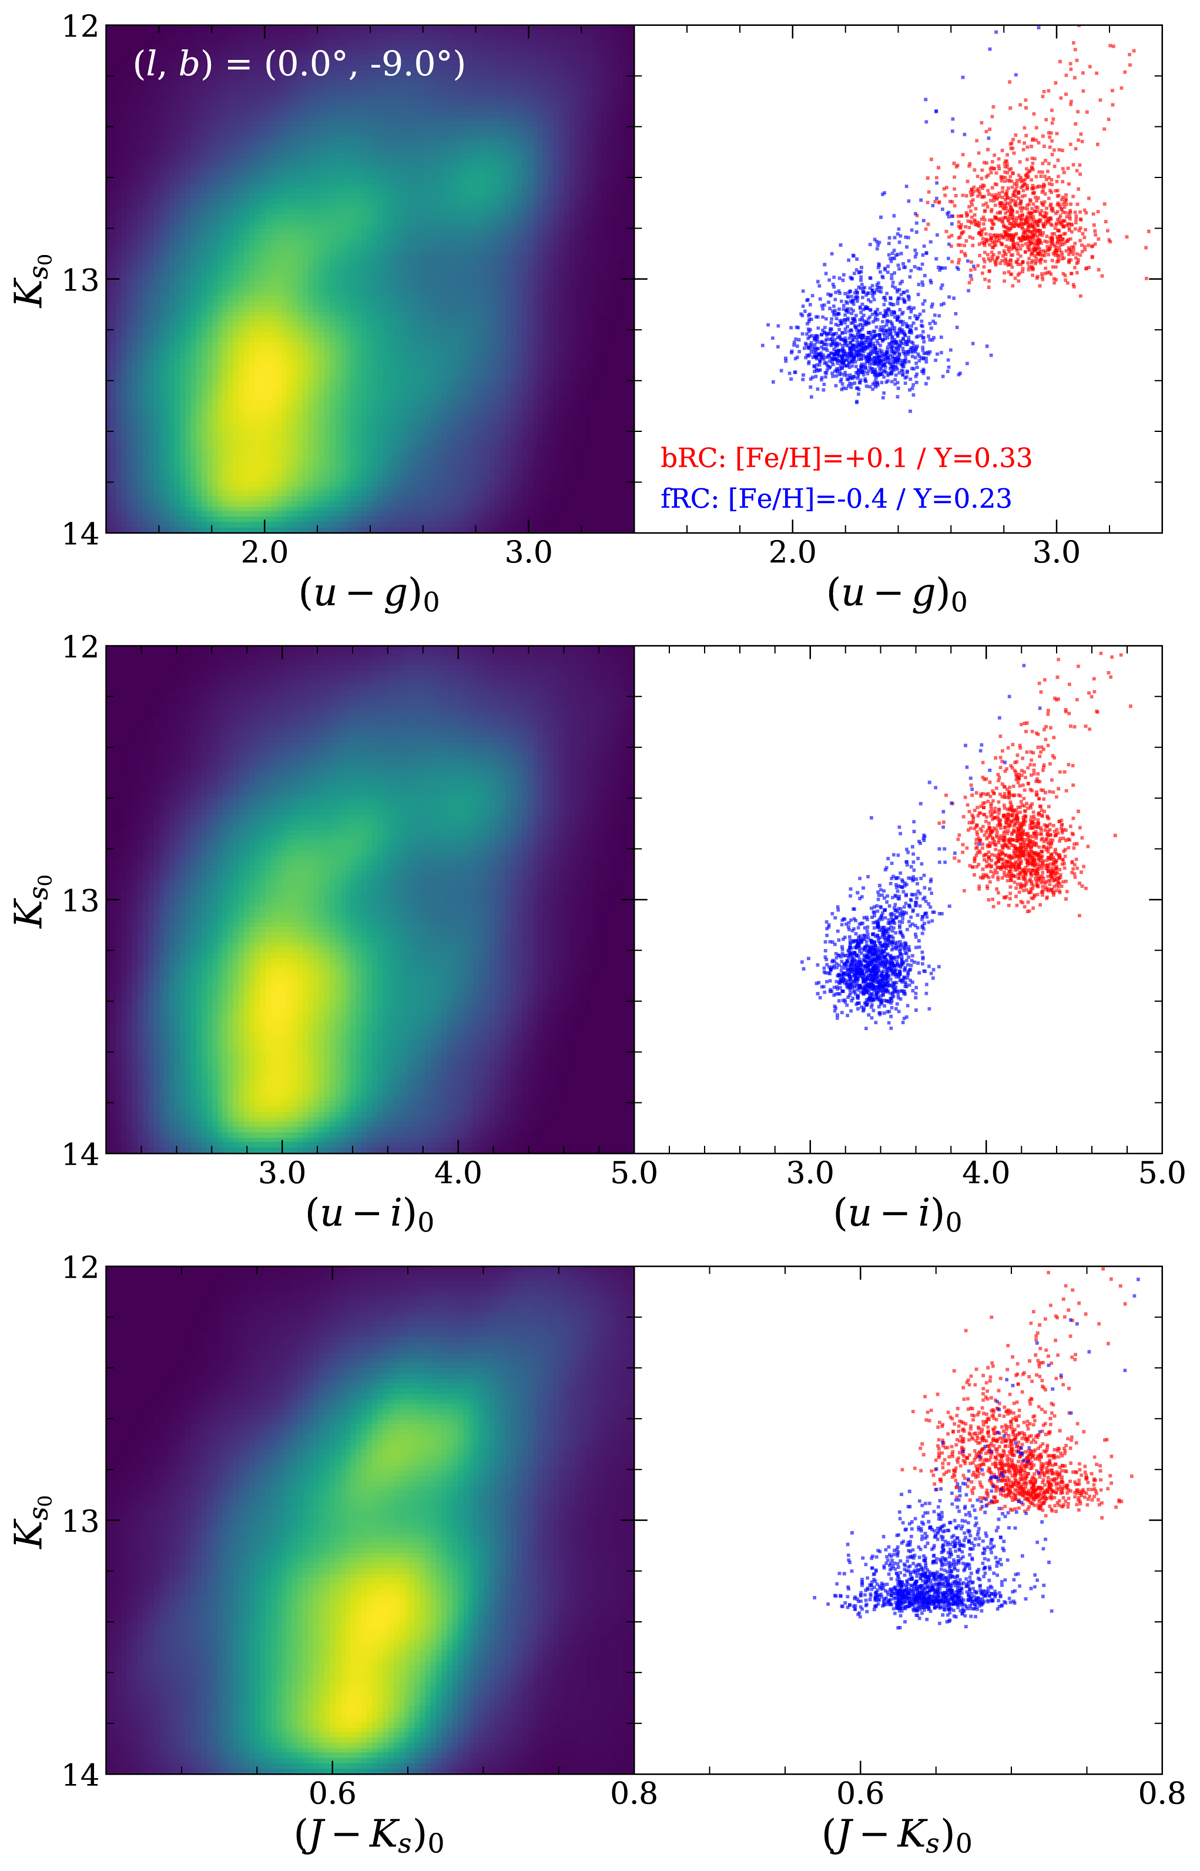
Comparison of our observation (left panels) with synthetic population models (right panels). The difference in the (u − g)0 and (u − i)0 colors, with similar (J − Ks)0 color, between the bRC and fRC can be reproduced with two-population models. The bRC models (red circles) are enhanced not only in [Fe/H] but also in He abundance with respect to the fRC models (blue circles) with Δ[Fe/H] = 0.5 dex and ΔY = 0.1.
Current usage metrics show cumulative count of Article Views (full-text article views including HTML views, PDF and ePub downloads, according to the available data) and Abstracts Views on Vision4Press platform.
Data correspond to usage on the plateform after 2015. The current usage metrics is available 48-96 hours after online publication and is updated daily on week days.
Initial download of the metrics may take a while.