Open Access
Fig. C.1.
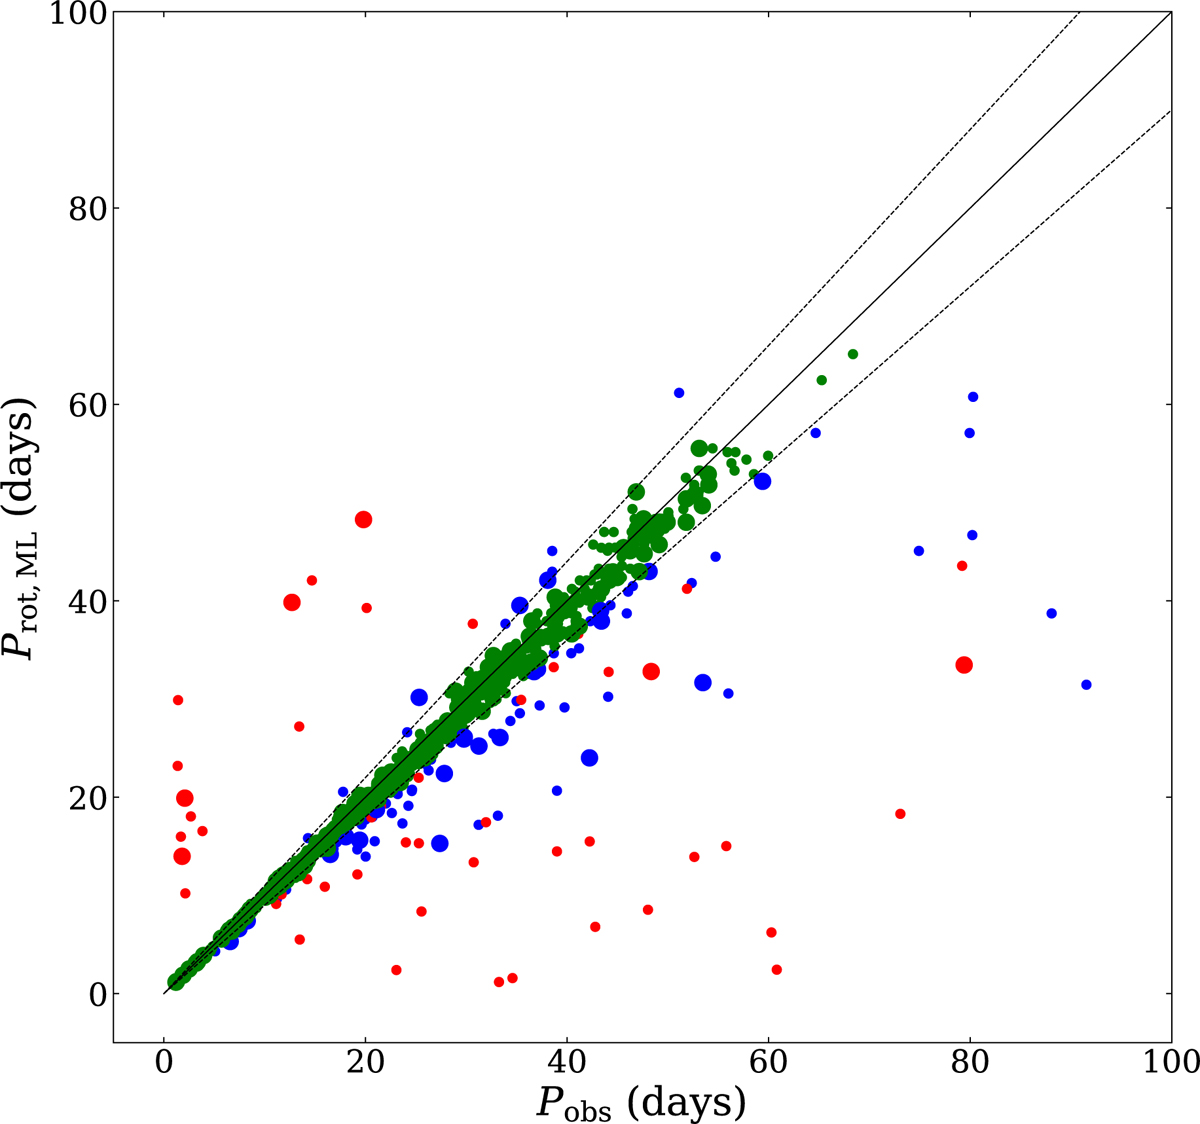
ROOSTER retrieved periods Prot, ML versus Pobs from Aigrain et al. (2015). Good periods are shown in green, ok in blue, and bad in red. Large circles mark noise-free light curves, while small circles mark noisy light curves.
Current usage metrics show cumulative count of Article Views (full-text article views including HTML views, PDF and ePub downloads, according to the available data) and Abstracts Views on Vision4Press platform.
Data correspond to usage on the plateform after 2015. The current usage metrics is available 48-96 hours after online publication and is updated daily on week days.
Initial download of the metrics may take a while.