Fig. 4.
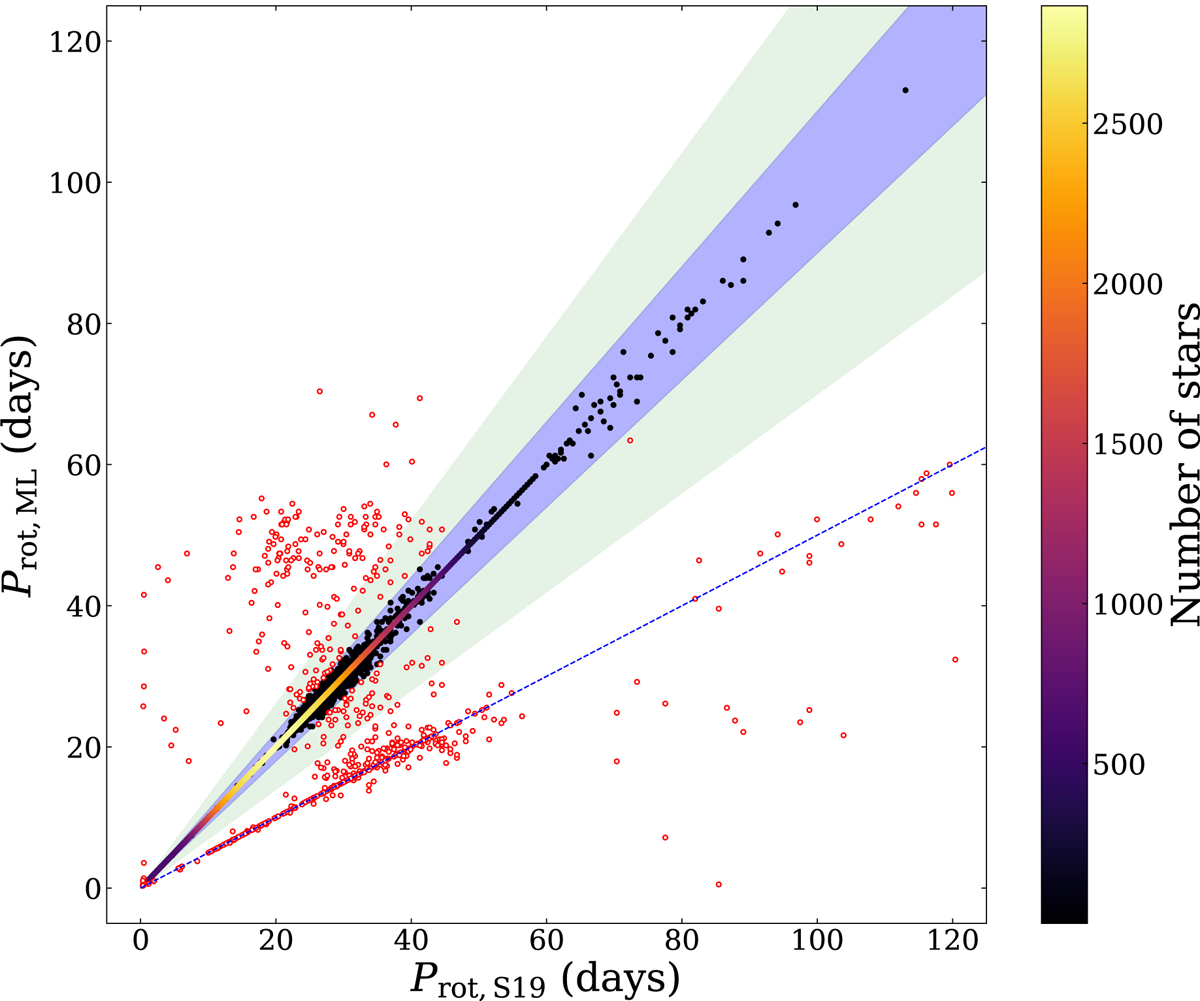
Comparison between Prot, ML and the values given in S19 for the stars of the PeriodSel sample. The shaded blue and green areas highlight the 10 and 30% agreement regions, respectively. The number of stars inside this area is colour coded. The stars outside the shaded area are represented by red dots. The dashed blue line corresponds 2:1 line.
Current usage metrics show cumulative count of Article Views (full-text article views including HTML views, PDF and ePub downloads, according to the available data) and Abstracts Views on Vision4Press platform.
Data correspond to usage on the plateform after 2015. The current usage metrics is available 48-96 hours after online publication and is updated daily on week days.
Initial download of the metrics may take a while.