Fig. 2.
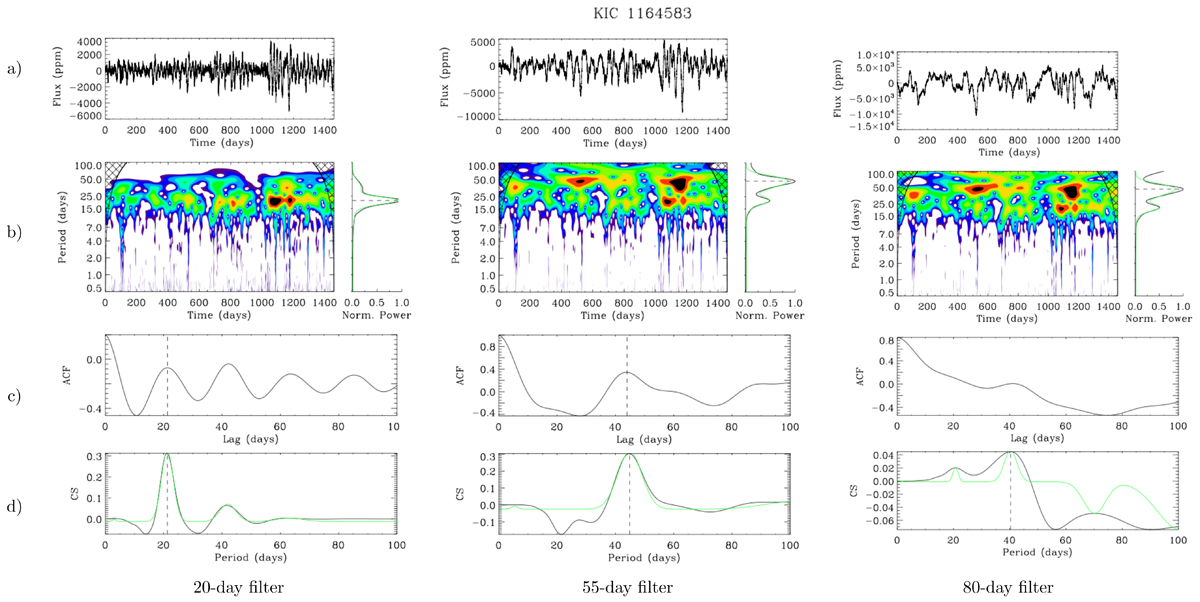
Comparison between the light curves obtained with the three high pass filters for KIC 1164583 (from left to right, 20, 55, and 80-day filter respectively). (a) KEPSEISMIC light curve. (b) Wavelet power spectrum (left) and global wavelet power spectrum (right). The grid represents the cone of influence of the reliable periodicity. High-amplitude power are highlighted by black and red whereas green and blue denote low-amplitude power. (c) Auto-Correlation Function. (d) Composite spectrum (black) and corresponding best fit with multiple Gaussian profiles (green). In all panels, the dashed line shows the position of the extracted rotation period.
Current usage metrics show cumulative count of Article Views (full-text article views including HTML views, PDF and ePub downloads, according to the available data) and Abstracts Views on Vision4Press platform.
Data correspond to usage on the plateform after 2015. The current usage metrics is available 48-96 hours after online publication and is updated daily on week days.
Initial download of the metrics may take a while.