Fig. 1.
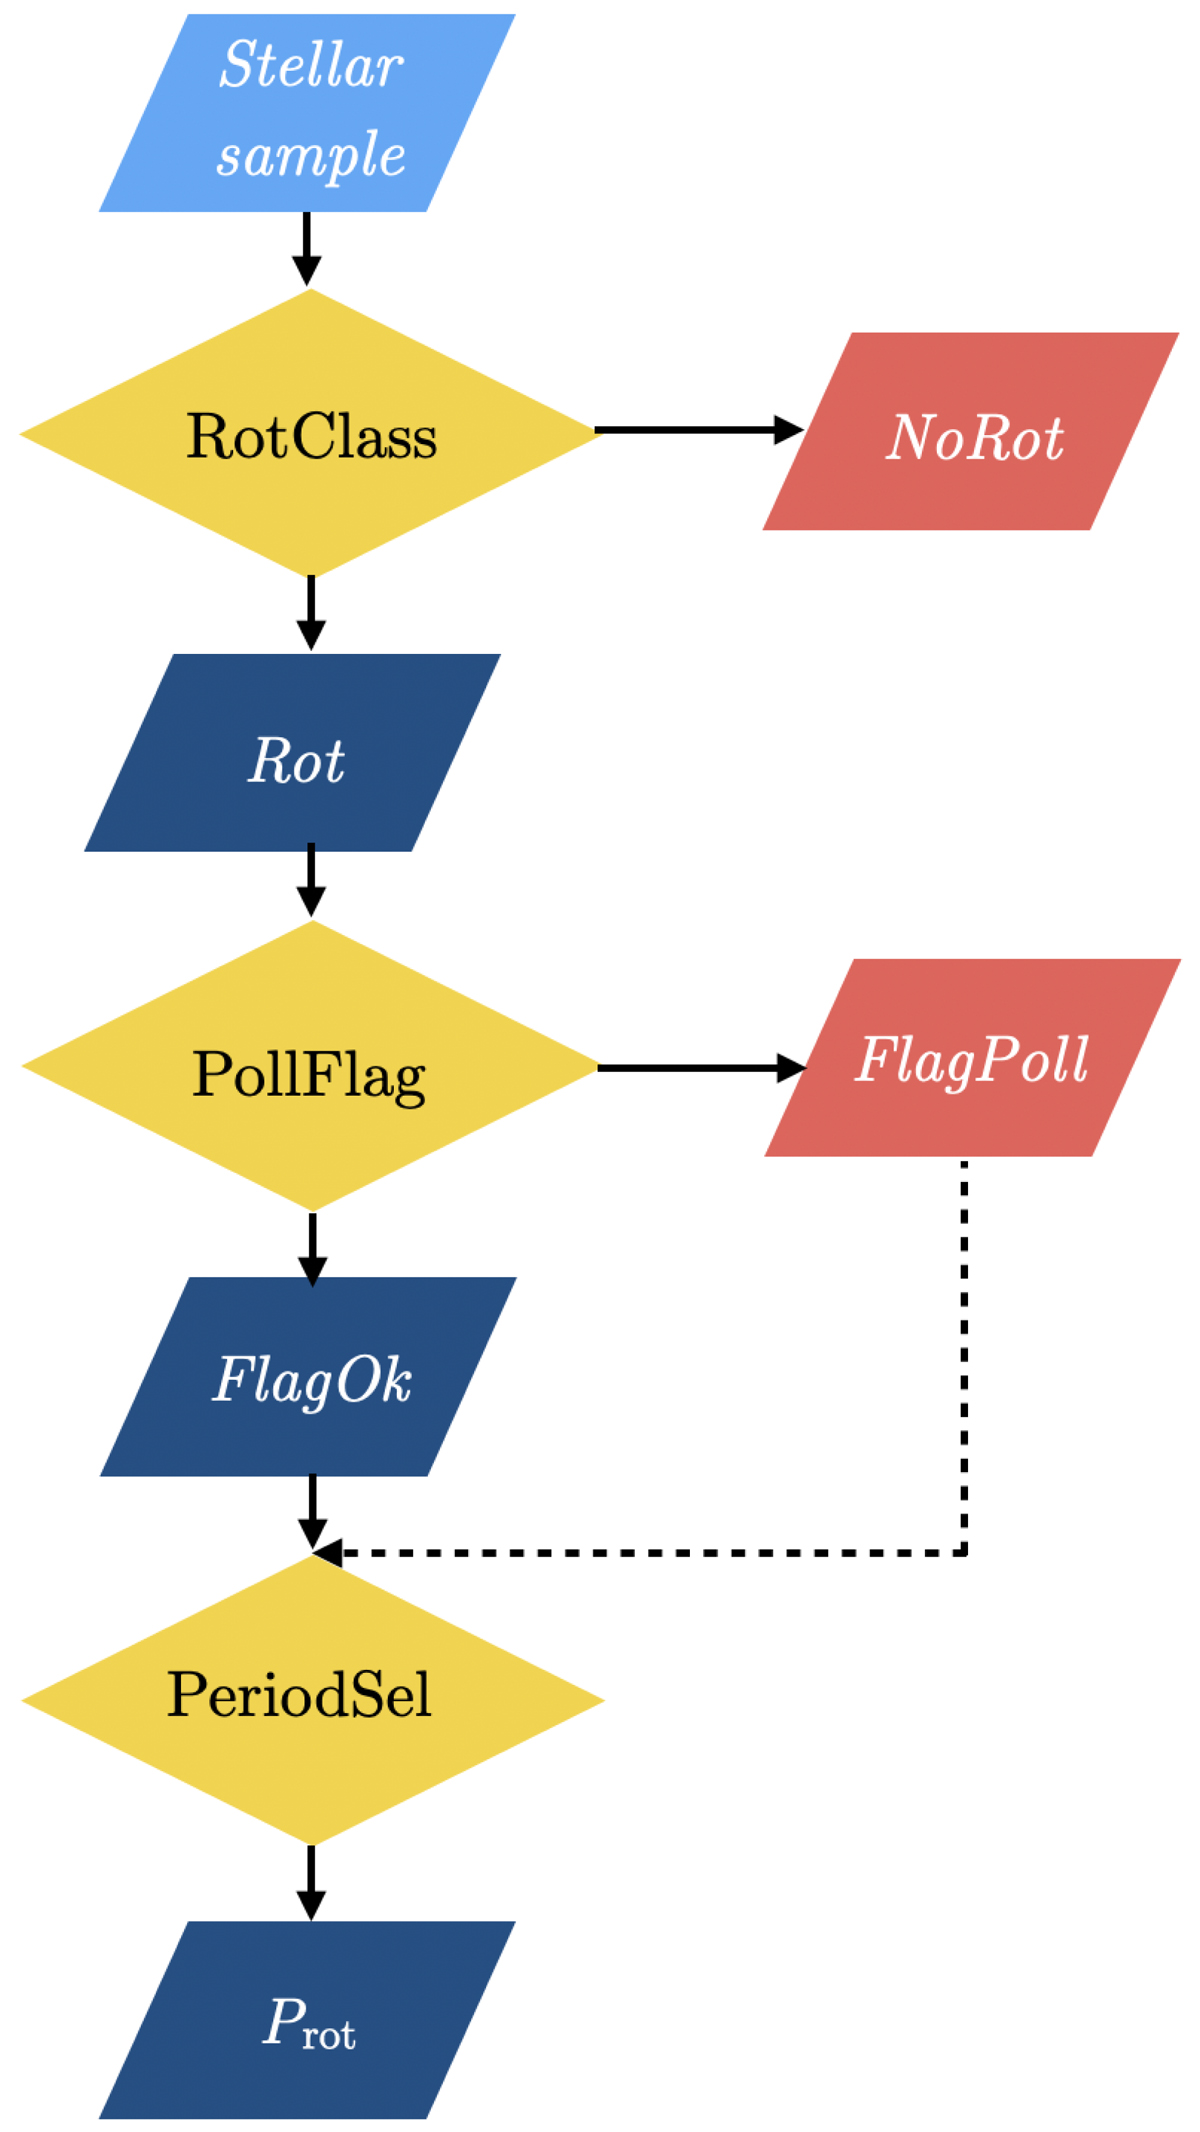
Structure of the ROOSTER pipeline. The yellow diamonds outline the action of each classifier used by the machine learning algorithm. The stars of the sample (lightblue parallelogram) are anlaysed by the pipeline. The red and dark blue parallelograms emphasis the label attributed by the ROOSTER classifiers to each star of the sample. First, stars with rotational modulation are selected by RotClass and the label Rot or NoRot is given. NoRot stars are not considered in the subsequent analysis. The PollFlag classifier flags Type 1 CP/CB candidates (labelled FlagPoll). The remainder of the stars receive the FlagOk label. Finally, the PeriodSel classifier selects the rotation period.
Current usage metrics show cumulative count of Article Views (full-text article views including HTML views, PDF and ePub downloads, according to the available data) and Abstracts Views on Vision4Press platform.
Data correspond to usage on the plateform after 2015. The current usage metrics is available 48-96 hours after online publication and is updated daily on week days.
Initial download of the metrics may take a while.