Fig. 9
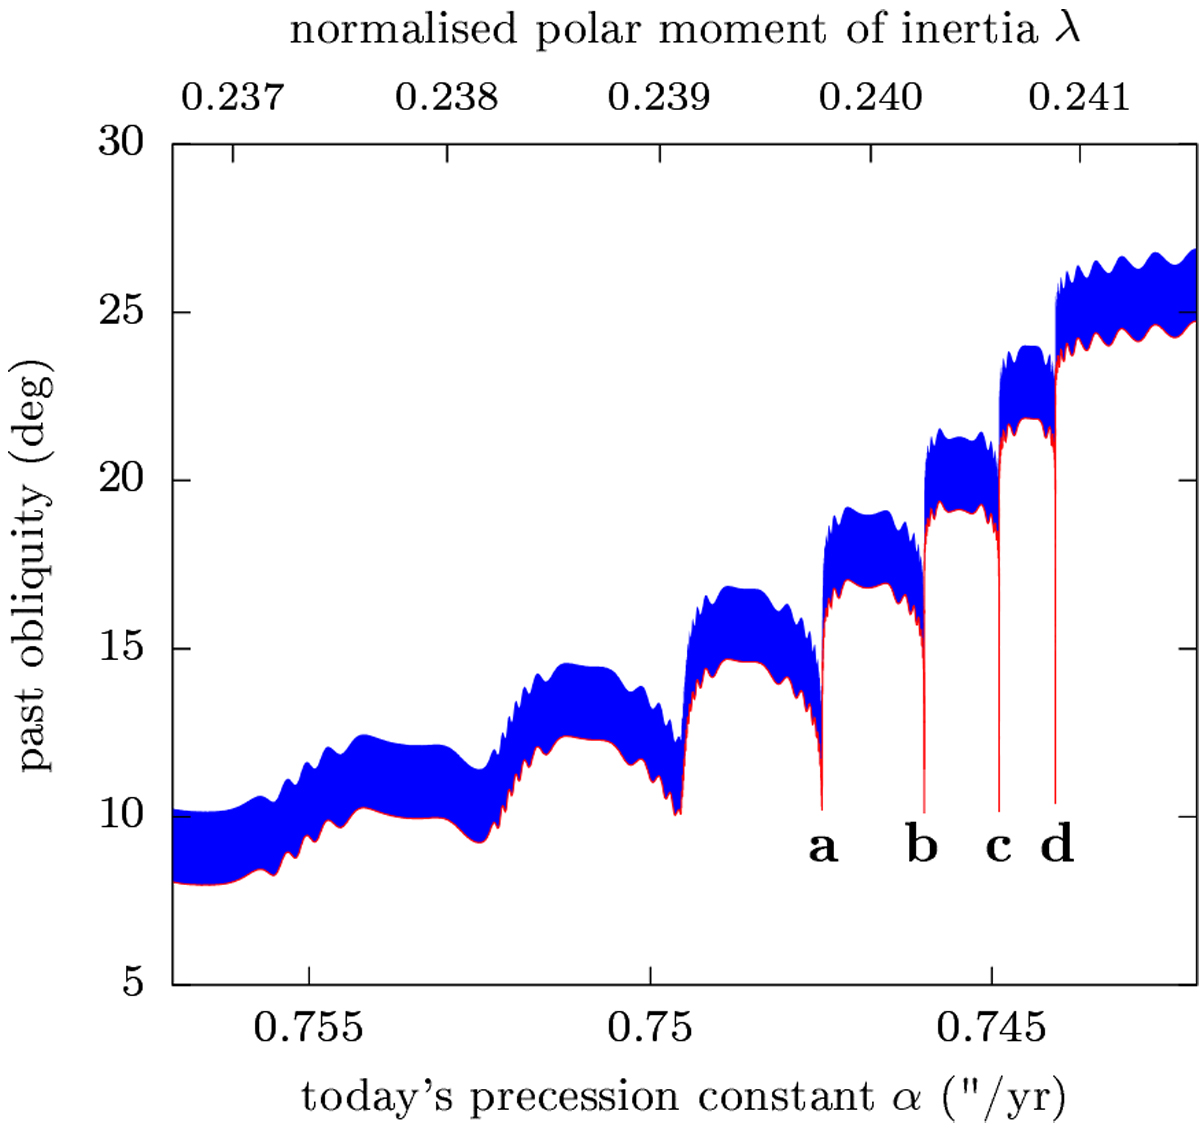
Zoom-in view of the central panel of Fig. 7. We use a red curve to highlight the bottom limit of the blue interval, otherwise the narrowness of the spikes makes them invisible (the width of spike d is Δλ ≈ 10−14). This graph can be compared to Fig. 3 of Saillenfest et al. (2021), where such level of fine tuning is not shown due to its questionable physical relevance. See Appendix B for examples of trajectories.
Current usage metrics show cumulative count of Article Views (full-text article views including HTML views, PDF and ePub downloads, according to the available data) and Abstracts Views on Vision4Press platform.
Data correspond to usage on the plateform after 2015. The current usage metrics is available 48-96 hours after online publication and is updated daily on week days.
Initial download of the metrics may take a while.