Fig. 8
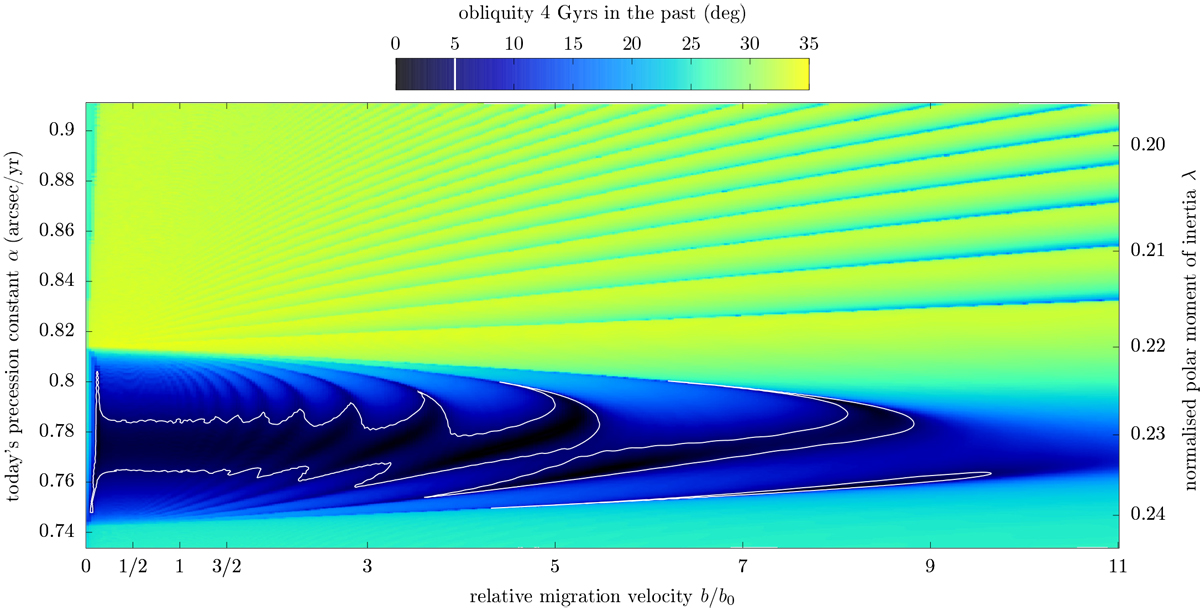
Past obliquity of Saturn as a function of Titan’s migration velocity and Saturn’s polar moment of inertia. Each panel of Fig. 7 corresponds here to a vertical slice. The colour scale depicts the minimum obliquity of the oscillation range, and the white curve highlights the 5° level. The 3σ uncertainty ranges of Lainey et al. (2020) yield today approximately b∕b0 ∈ [1∕2, 5] for the astrometric measurements and b∕b0 ∈ [1, 3∕2] for the radio-science experiments (see Fig. 3).
Current usage metrics show cumulative count of Article Views (full-text article views including HTML views, PDF and ePub downloads, according to the available data) and Abstracts Views on Vision4Press platform.
Data correspond to usage on the plateform after 2015. The current usage metrics is available 48-96 hours after online publication and is updated daily on week days.
Initial download of the metrics may take a while.