Fig. 7
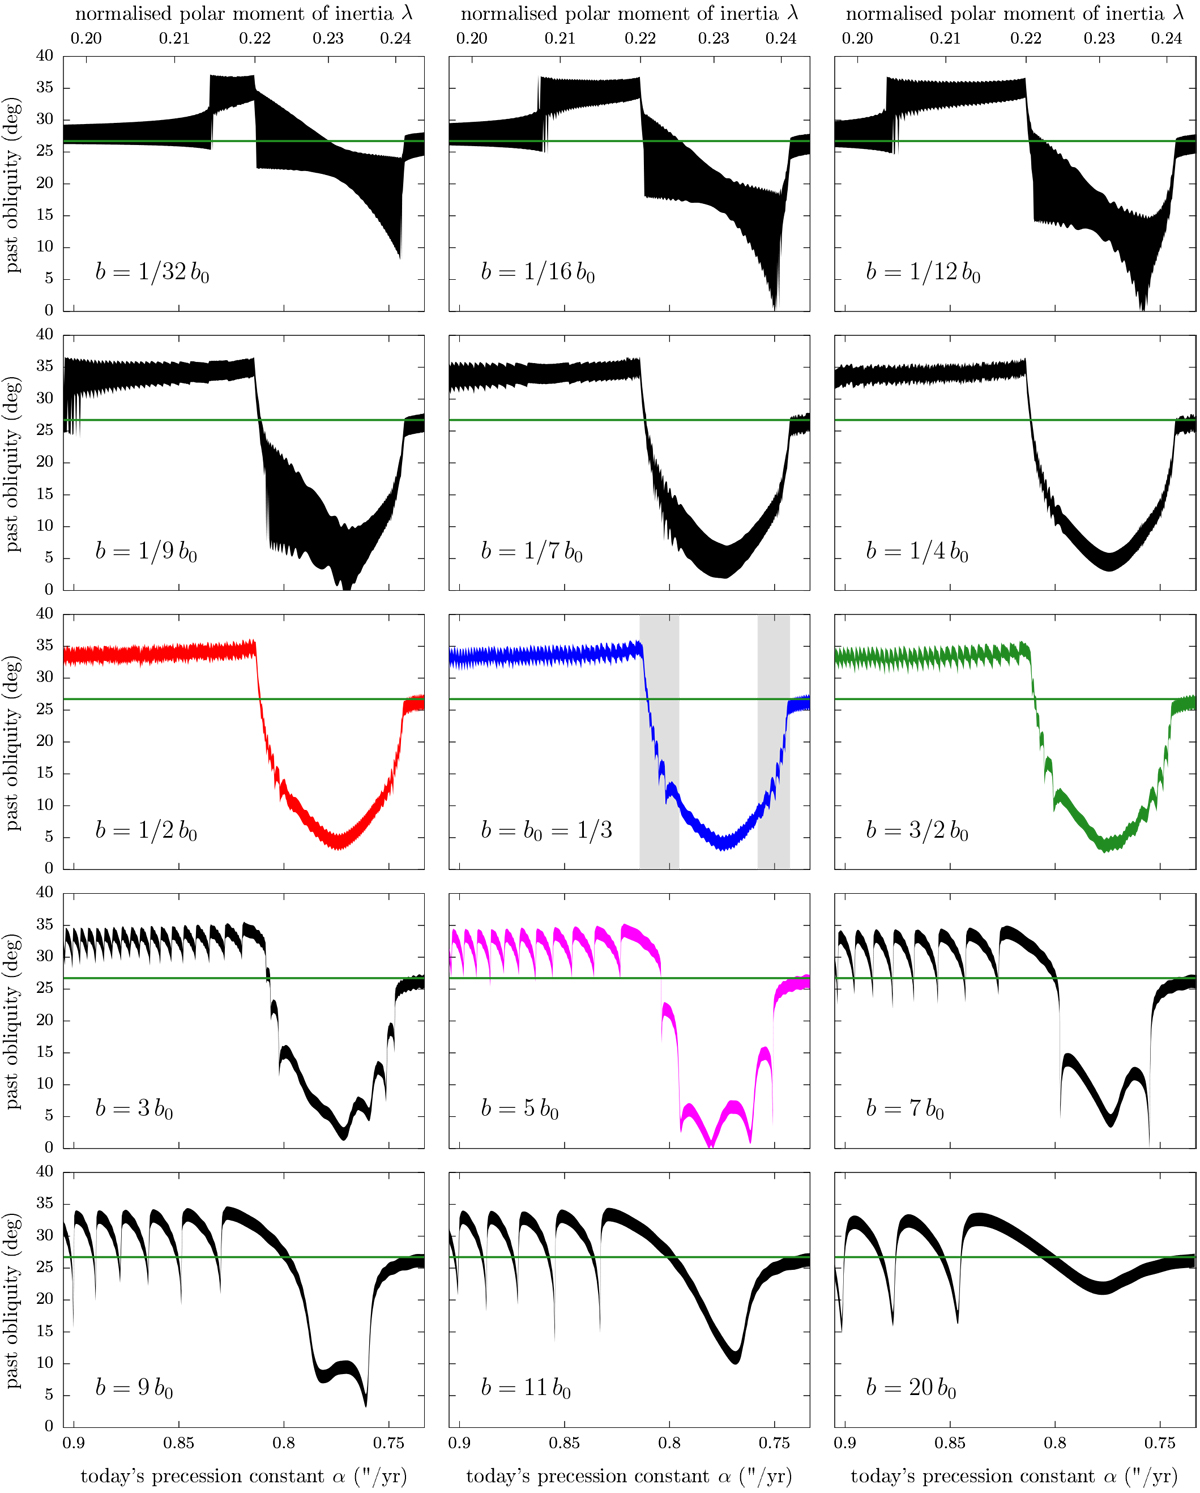
Past obliquity of Saturn for different migration rates of Titan. The top and bottom horizontal axes are the same as in Fig. 5 and the horizontal green line shows Saturn’s current obliquity. For a given value of the normalised polar moment of inertia λ (top horizontal axis), the curve width shows the oscillation range of obliquity 4 Gyr in the past obtained by backward numerical integration. The migration rates are labelled on each panel as a fraction of the nominal rate of Lainey et al. (2020). The four coloured curves correspond to the migration rates illustrated in Fig. 3. The grey stripes in the central panel highlight trajectories of Type 2 (same as in Fig. 5). The value of b in the top left panel corresponds to a current quality factor Q equal to 5000 (see Lainey et al. 2020).
Current usage metrics show cumulative count of Article Views (full-text article views including HTML views, PDF and ePub downloads, according to the available data) and Abstracts Views on Vision4Press platform.
Data correspond to usage on the plateform after 2015. The current usage metrics is available 48-96 hours after online publication and is updated daily on week days.
Initial download of the metrics may take a while.