Fig. 4
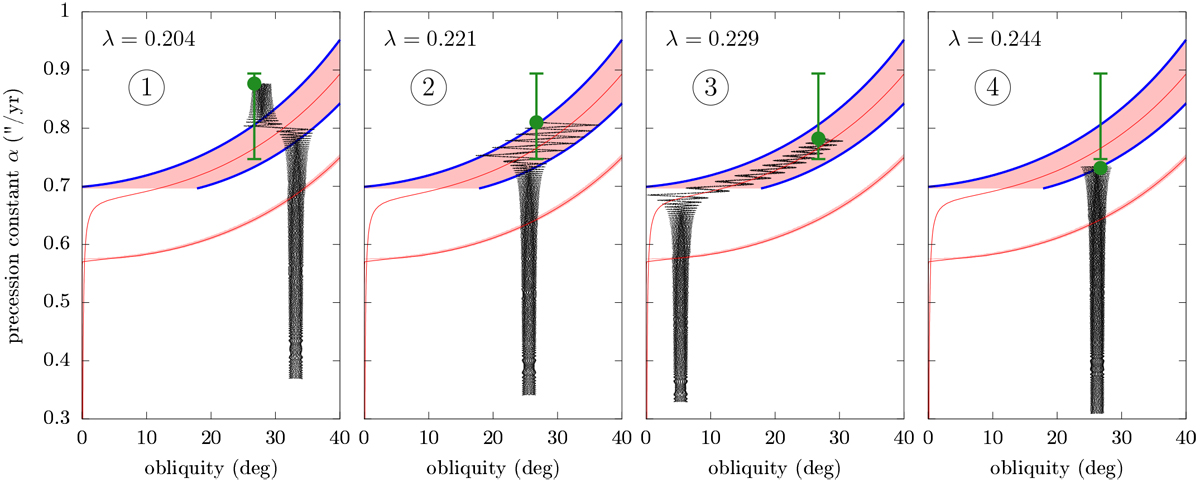
Examples illustrating the four different types of past obliquity evolution of Saturn. Each graph shows a 4-Gyr numerical trajectory (black dots) computed for Titan’s nominal migration rate and for a given value of Saturn’s normalised polar moment of inertia ![]() specifiedin title. Today’s location of Saturn is represented by the big green spot; the vertical error bar corresponds to our full exploration interval of
λ. The red curves show the centre of first-order secular spin-orbit resonances (Cassini state 2) and the coloured areas represent their widths (same as Fig. 1). The top large area is the resonance with
ϕ3 and the bottom thin area is the resonance with ϕ19
(see Table 1). The separatrices of the ϕ3
resonance are highlighted in blue. Going forwards in time, the trajectories go from bottom to top.
specifiedin title. Today’s location of Saturn is represented by the big green spot; the vertical error bar corresponds to our full exploration interval of
λ. The red curves show the centre of first-order secular spin-orbit resonances (Cassini state 2) and the coloured areas represent their widths (same as Fig. 1). The top large area is the resonance with
ϕ3 and the bottom thin area is the resonance with ϕ19
(see Table 1). The separatrices of the ϕ3
resonance are highlighted in blue. Going forwards in time, the trajectories go from bottom to top.
Current usage metrics show cumulative count of Article Views (full-text article views including HTML views, PDF and ePub downloads, according to the available data) and Abstracts Views on Vision4Press platform.
Data correspond to usage on the plateform after 2015. The current usage metrics is available 48-96 hours after online publication and is updated daily on week days.
Initial download of the metrics may take a while.