Open Access
Fig. 3
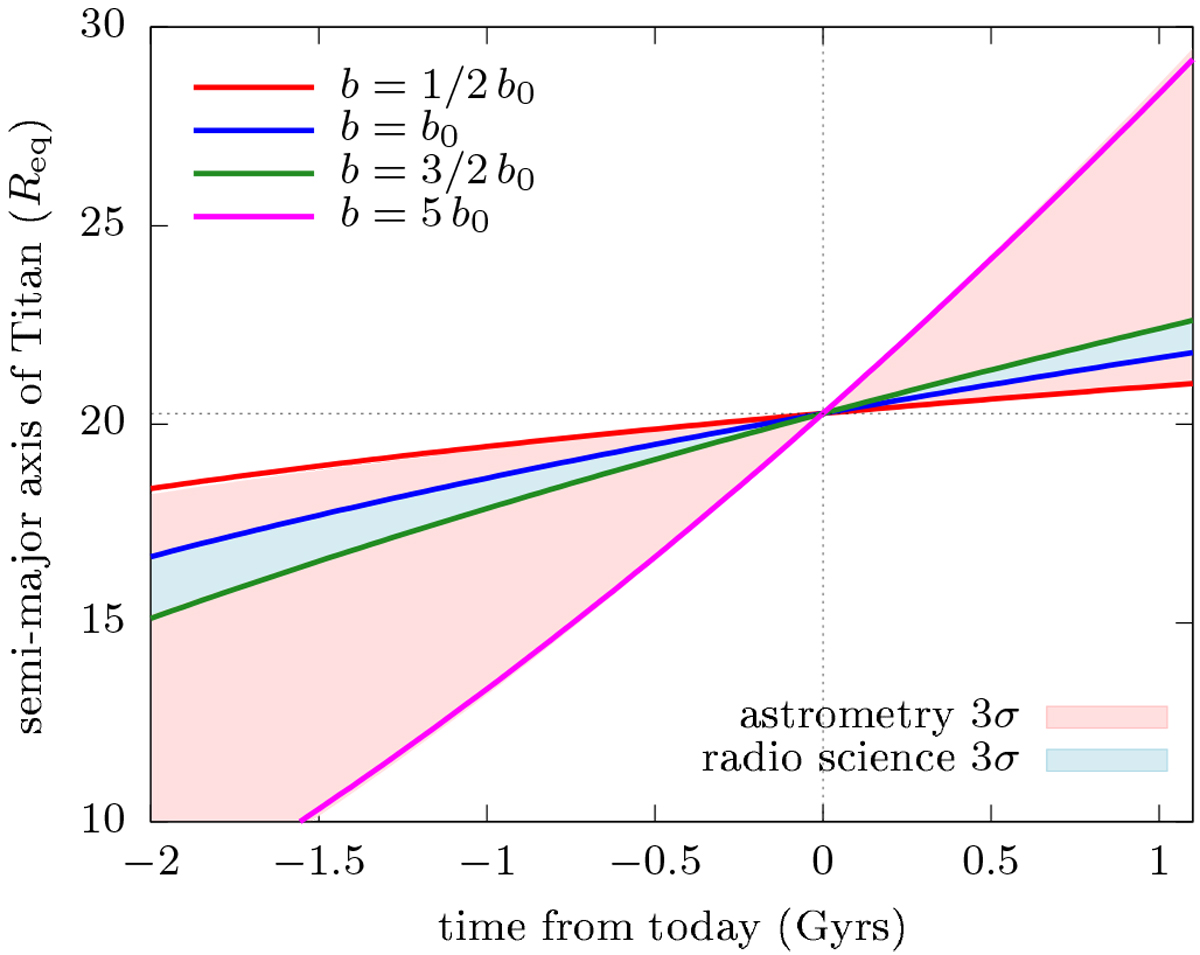
Time evolution of Titan’s semi-major axis for different migration rates. The pink and blue intervals show the 3σ uncertainty ranges of astrometric and radio-science measurements, respectively (Lainey et al. 2020). The coloured curves are obtained by varying the parameter b in Eq. (9).
Current usage metrics show cumulative count of Article Views (full-text article views including HTML views, PDF and ePub downloads, according to the available data) and Abstracts Views on Vision4Press platform.
Data correspond to usage on the plateform after 2015. The current usage metrics is available 48-96 hours after online publication and is updated daily on week days.
Initial download of the metrics may take a while.