Fig. C.3
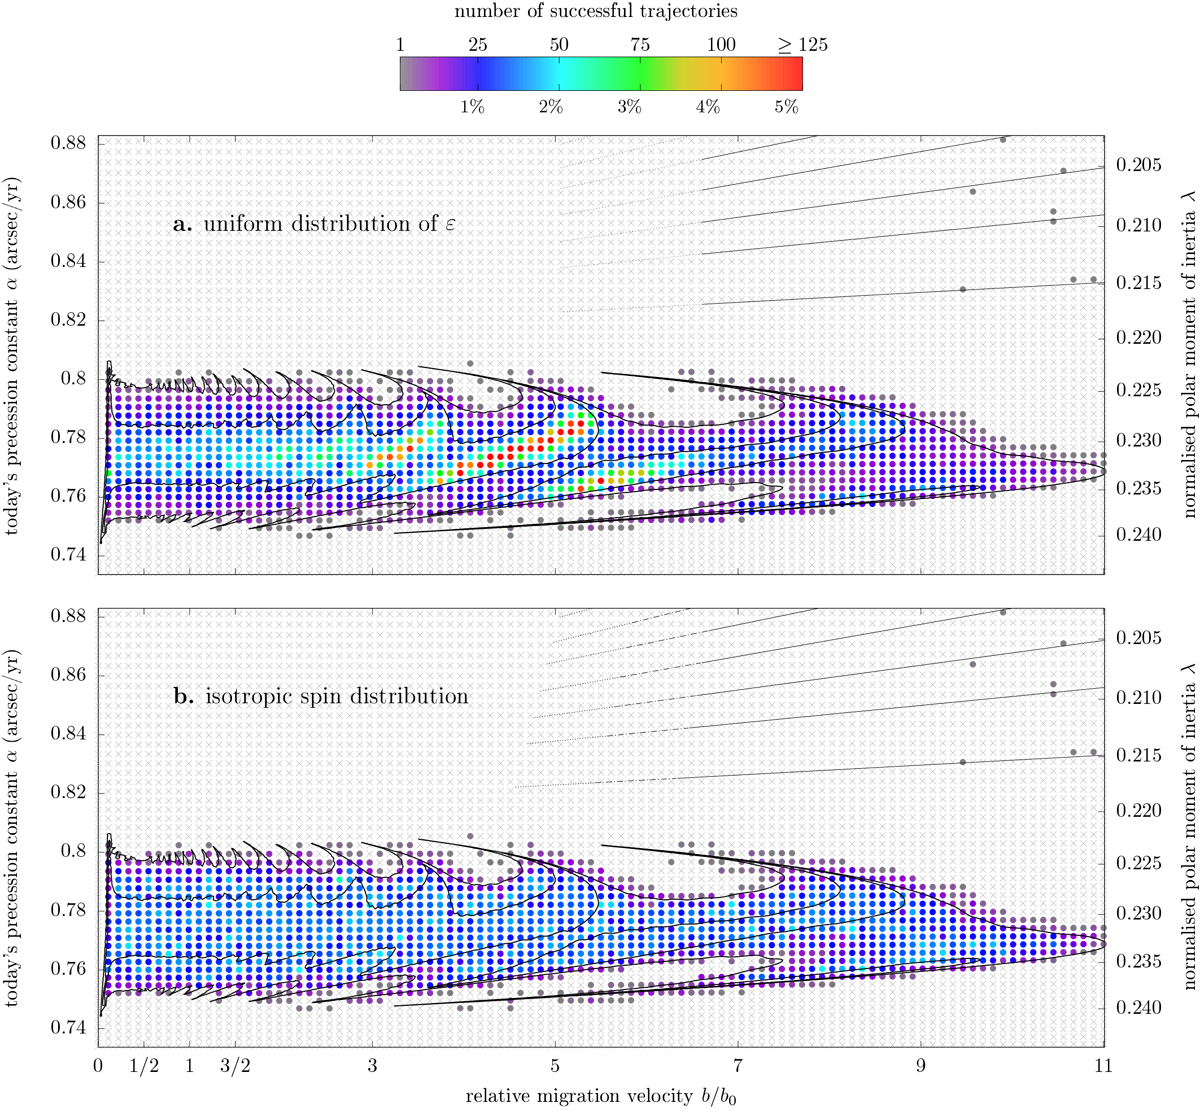
Same as Fig. 14, but for a range of initial spin orientations enlarged to 0° ≤ ε ≤ 10°. Each point is made of 2400 numerical simulations. (a) Uniform random distribution of (ε, ψ) ∈ [0°, 10°] × [0, 2π). (b) Uniform random distribution of (ε, ψ) over the spherical cap defined by ε ≤ 10°. As in Fig. C.1, panel b is obtained by weighting the count numbers of panel a. The black contours show the 5° and 10° levels obtained through backward numerical integrations (see Fig. 8).
Current usage metrics show cumulative count of Article Views (full-text article views including HTML views, PDF and ePub downloads, according to the available data) and Abstracts Views on Vision4Press platform.
Data correspond to usage on the plateform after 2015. The current usage metrics is available 48-96 hours after online publication and is updated daily on week days.
Initial download of the metrics may take a while.