Fig. C.2
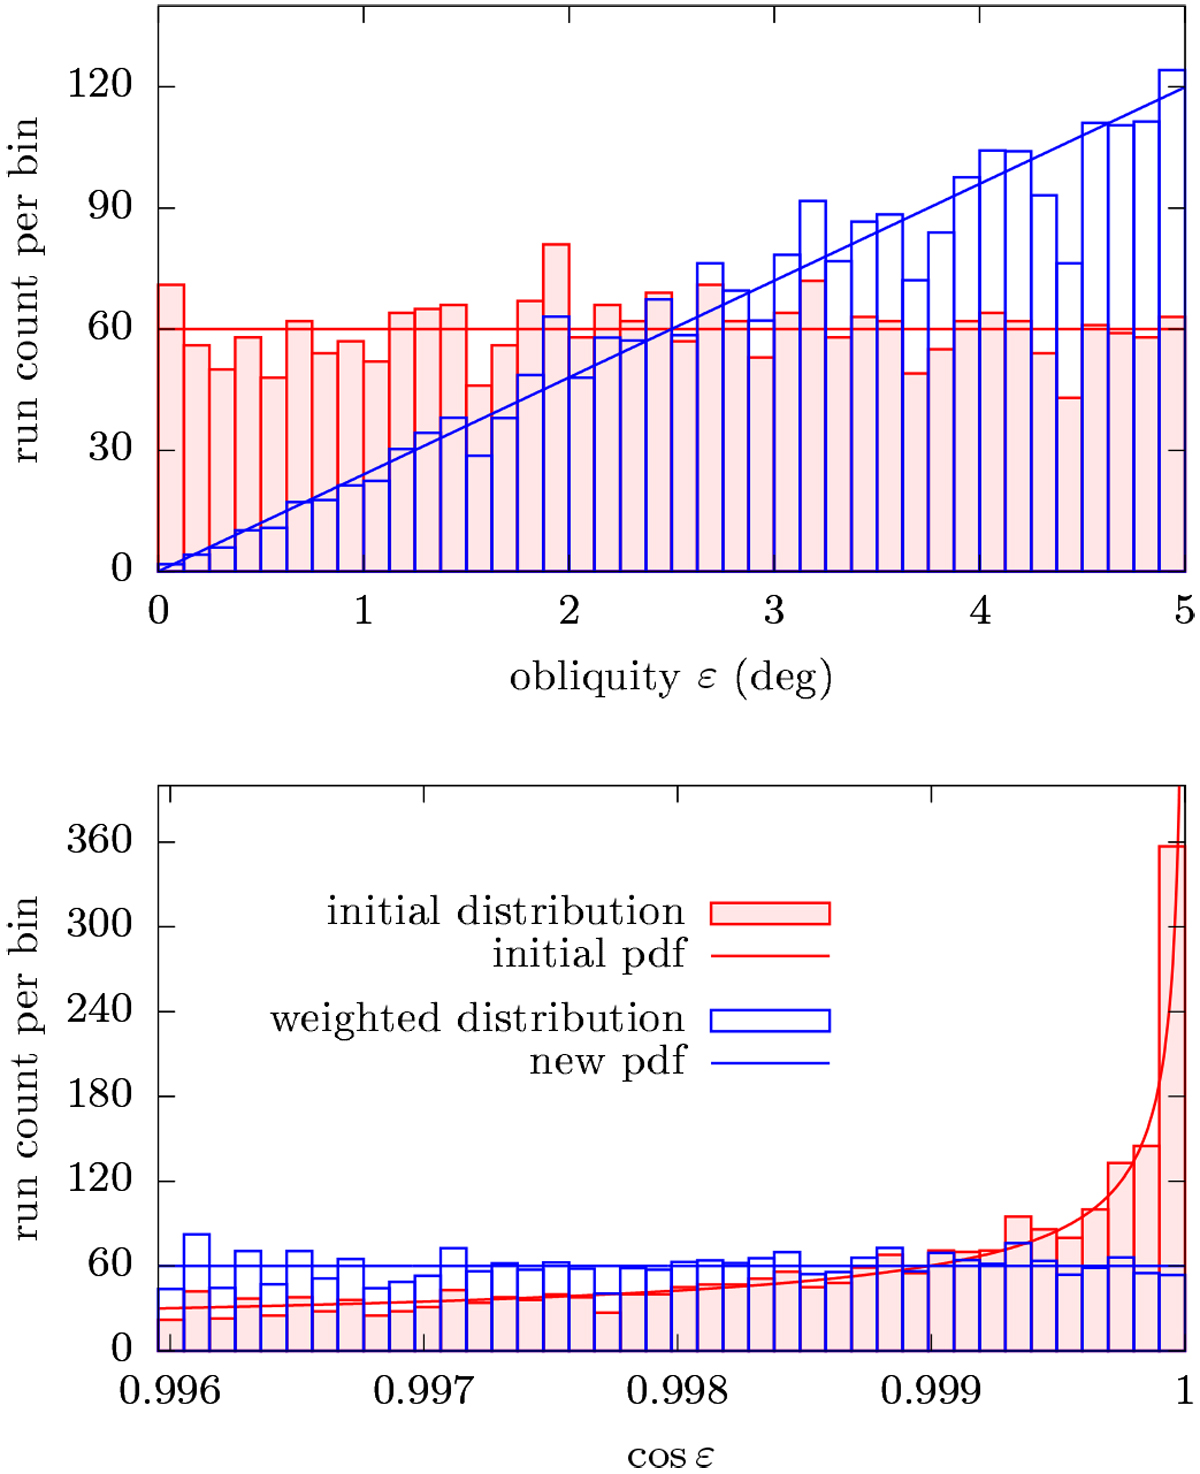
Sampled distribution of initial obliquity for one arbitrary point of Fig. 14, made of 2400 simulations. The raw count of sampled trajectories is shown in red; the weighted count is shown in blue. Top: histogram with respectto the obliquity. Bottom: histogram with respect to the cosine of obliquity. The probability density functions (‘pdf’) are shown by the red and blue curves.
Current usage metrics show cumulative count of Article Views (full-text article views including HTML views, PDF and ePub downloads, according to the available data) and Abstracts Views on Vision4Press platform.
Data correspond to usage on the plateform after 2015. The current usage metrics is available 48-96 hours after online publication and is updated daily on week days.
Initial download of the metrics may take a while.