Fig. 2
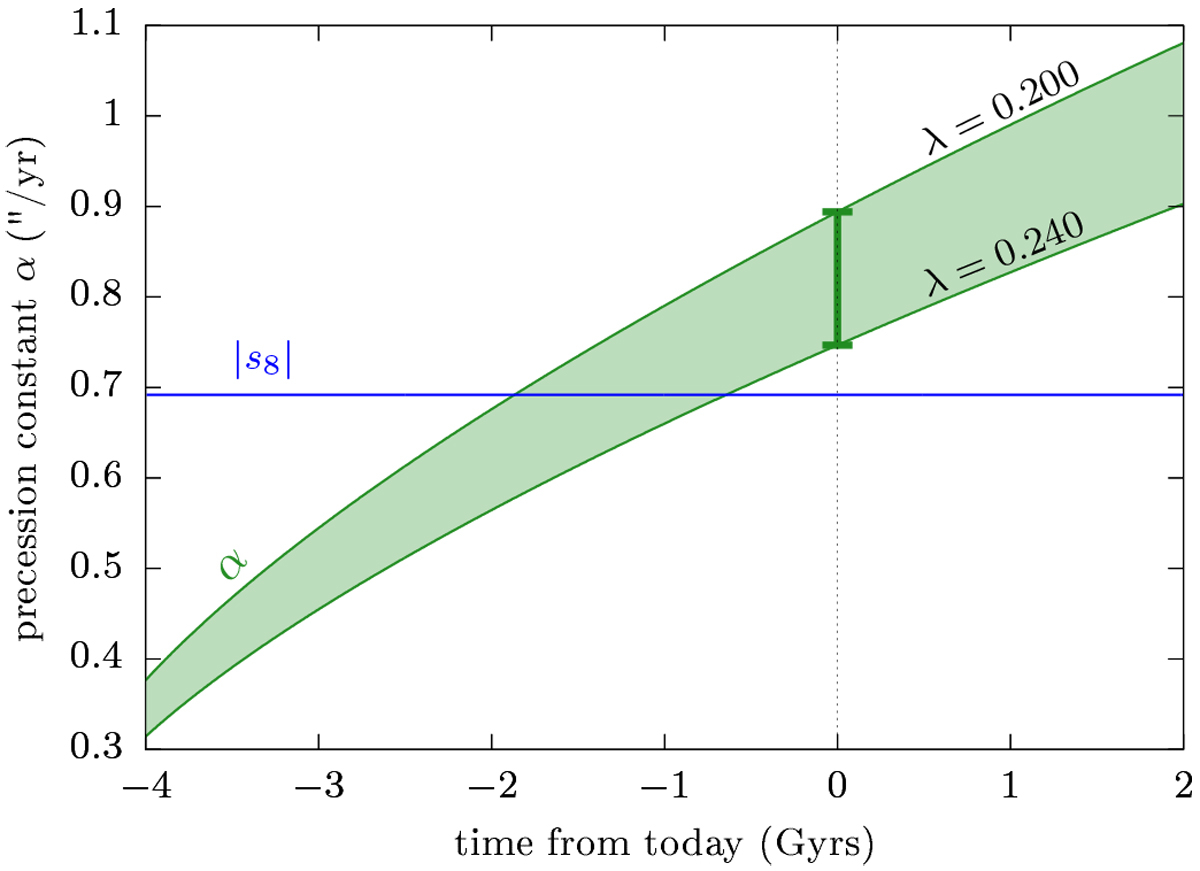
Evolution of the effective precession constant of Saturn due to the migration of Titan (adapted from Saillenfest et al. 2021). The top and bottom green curves correspond to the two extreme values of the normalised polar moment of inertia λ considered in this article. They appear into α through Eq. (3). Both curves are obtained using the nominal value b = 1∕3 in Eq. (9). Today’s interval corresponds to the one shown in Fig. 1; it is independent of the value of b considered. The blue line shows Neptune’s nodal precession mode, which was higher before the end of the late planetary migration.
Current usage metrics show cumulative count of Article Views (full-text article views including HTML views, PDF and ePub downloads, according to the available data) and Abstracts Views on Vision4Press platform.
Data correspond to usage on the plateform after 2015. The current usage metrics is available 48-96 hours after online publication and is updated daily on week days.
Initial download of the metrics may take a while.