Fig. B.1
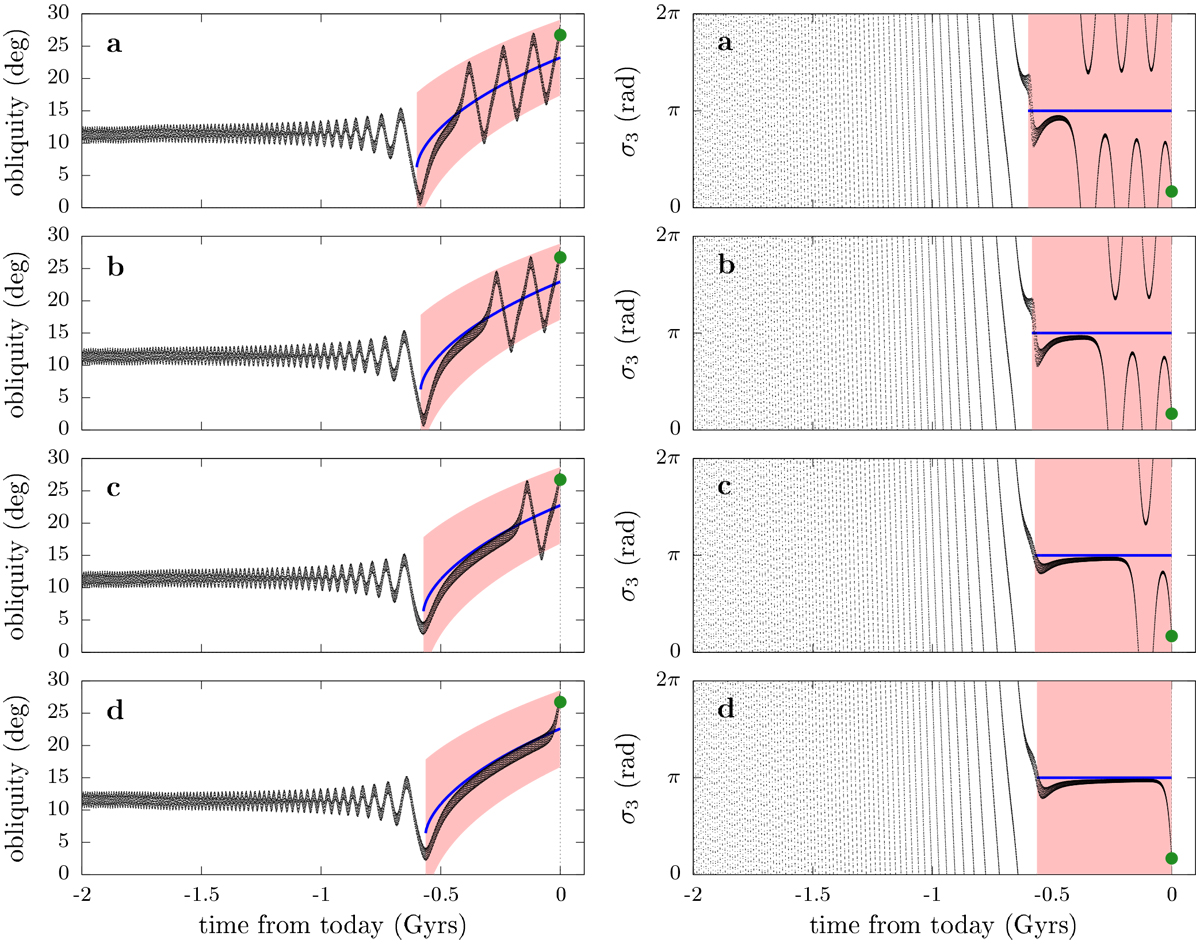
Example of trajectories featuring an extreme phase effect. Left column: evolution of the obliquity, and right column: evolution of the resonant angle σ3 = ψ + ϕ3. The migration parameter is b = b0. For each row, the parameter λ used corresponds to the tip of a spike in Fig. 9 (see labels), tuned at the 10−15 level. The pink area represents the interval occupied by the resonance once the separatrix appears. The blue curve shows the locationof the hyperbolic equilibrium point (Cassini state 4). The green point shows Saturn current location (at t = 0).
Current usage metrics show cumulative count of Article Views (full-text article views including HTML views, PDF and ePub downloads, according to the available data) and Abstracts Views on Vision4Press platform.
Data correspond to usage on the plateform after 2015. The current usage metrics is available 48-96 hours after online publication and is updated daily on week days.
Initial download of the metrics may take a while.