Fig. 14
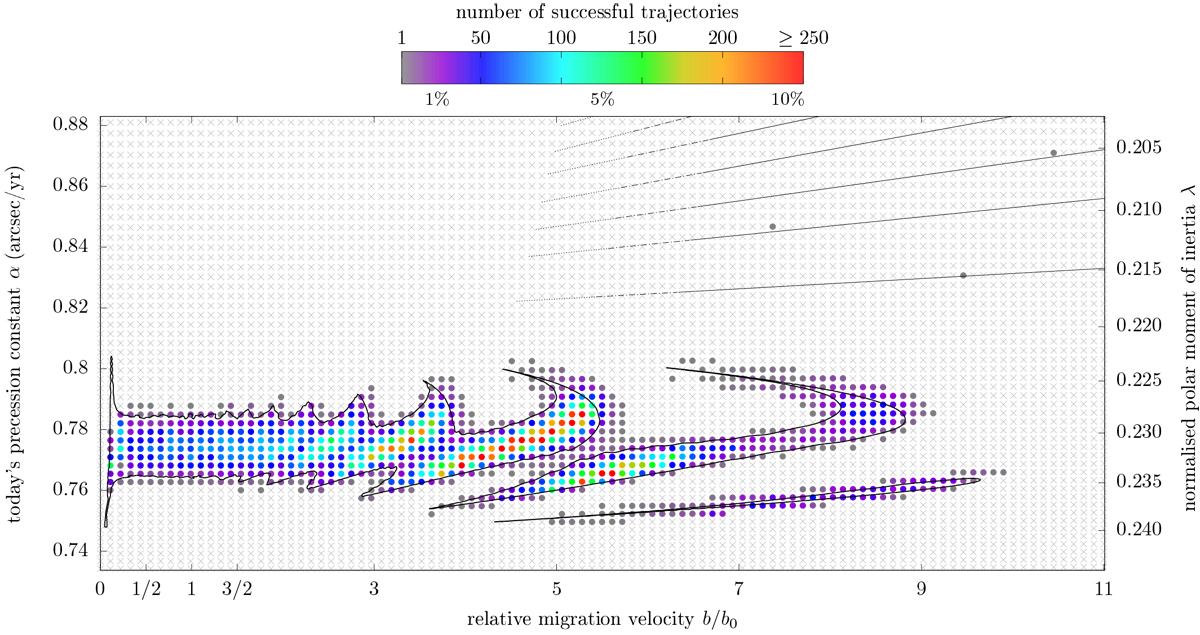
Distribution of the solutions starting from a low primordial obliquity and matching our strict success criteria. For each set (b, λ) of the parameters, 2400 values of initial obliquity ε and precession angle ψ are drawn from a uniform random distribution in (ε, ψ) ∈ [0°, 5°] × [0, 2π). Coloured dots show the parameter sets (b, λ) for which at least one successful trajectory was found; the success ratio is written below the colour bar. Light-grey crosses mean that no successful trajectory was found over our 2400 initial conditions. The black contours show the 5°-level obtained through backward numerical integrations (same as Fig. 8), showing the consistency between backward and forward integrations in time. The black lines in the top portion show the approximate location of the border of the blue stripes in Fig. 8, where extreme phase effects can happen; the corresponding ranges of parameters are so narrow that they are missed by the resolution of Fig. 8 (see Sect. 3.3).
Current usage metrics show cumulative count of Article Views (full-text article views including HTML views, PDF and ePub downloads, according to the available data) and Abstracts Views on Vision4Press platform.
Data correspond to usage on the plateform after 2015. The current usage metrics is available 48-96 hours after online publication and is updated daily on week days.
Initial download of the metrics may take a while.