Fig. 10
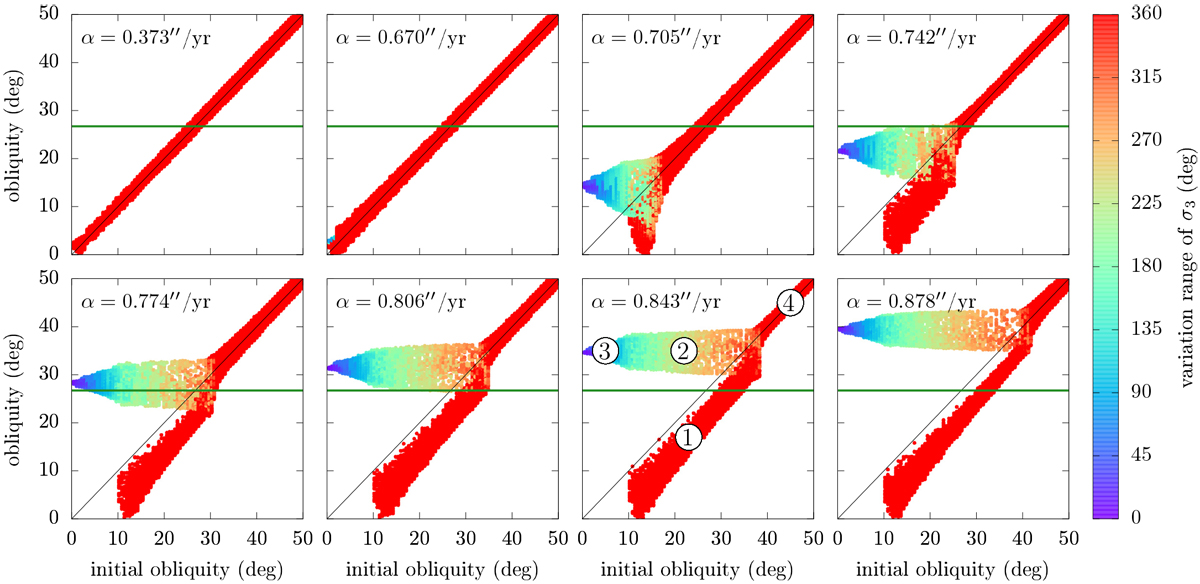
Snapshots of a Monte Carlo experiment computed for λ = 0.204 and Titan’s nominal migration rate. This experiment features 101 values of initial obliquity between 0° and 60°, for which 240 values of initial precession angle are regularly sampled in [0, 2π). The value of α reached by the trajectories at the time of the snapshot is labelled on each panel. Each trajectory is represented by a small dot which is coloured according to the variation range of the resonant angle σ3 (obtained bya 0.5-Gyr numerical integration with constant α). The horizontal green line shows the current obliquity of Saturn. At the beginning of the propagations, all trajectories are coloured red (since σ3 circulates), and distributed along a diagonal line. Then, as α increases over time, trajectories are dispersed off the diagonal according to the four types of trajectories depicted in Fig. 4 and labelled in the penultimate panel.
Current usage metrics show cumulative count of Article Views (full-text article views including HTML views, PDF and ePub downloads, according to the available data) and Abstracts Views on Vision4Press platform.
Data correspond to usage on the plateform after 2015. The current usage metrics is available 48-96 hours after online publication and is updated daily on week days.
Initial download of the metrics may take a while.