Open Access
Fig. 8
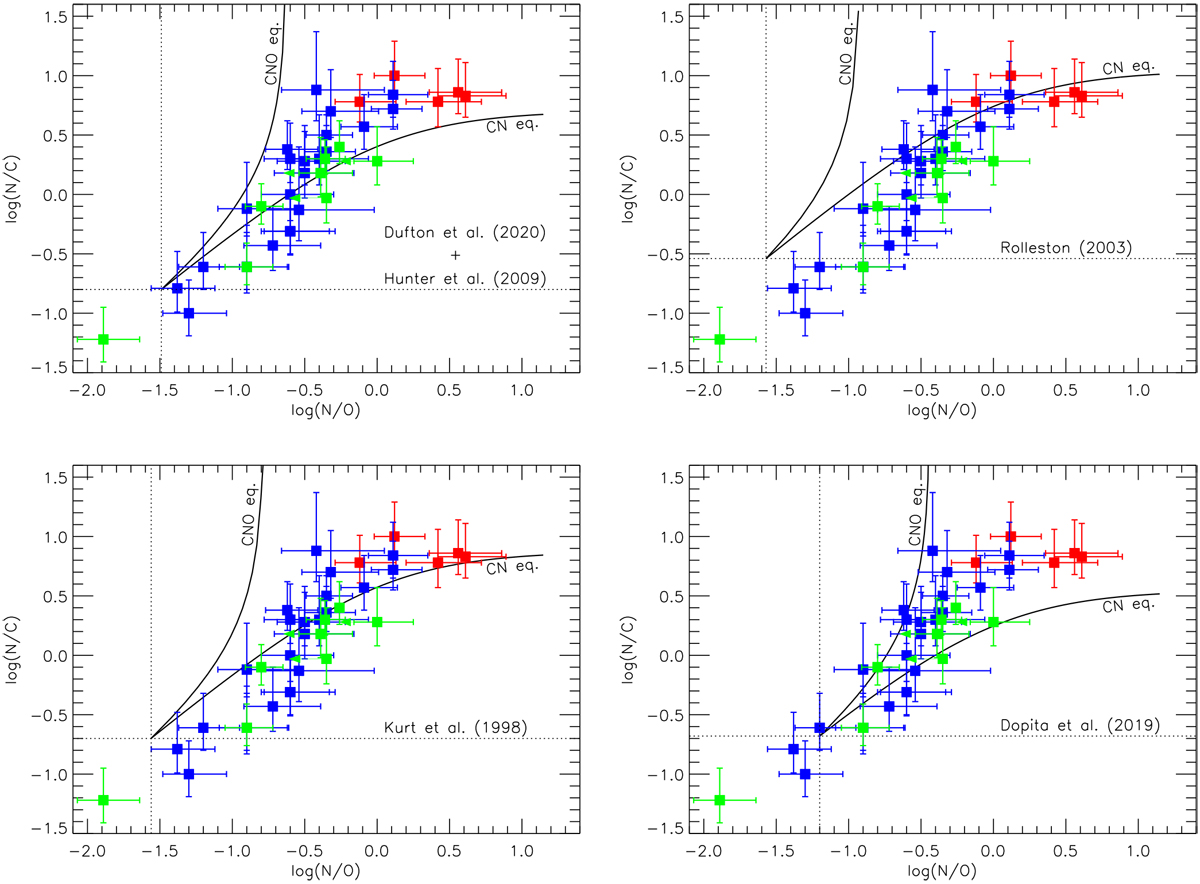
log (N/C) vs. log (N/O) abundances (by number) for the sample stars. Solid lines indicate the expected trends for the case of the partial CN and complete CNO equilibrium for various initial mixture (see text for details).
Current usage metrics show cumulative count of Article Views (full-text article views including HTML views, PDF and ePub downloads, according to the available data) and Abstracts Views on Vision4Press platform.
Data correspond to usage on the plateform after 2015. The current usage metrics is available 48-96 hours after online publication and is updated daily on week days.
Initial download of the metrics may take a while.