Fig. 4
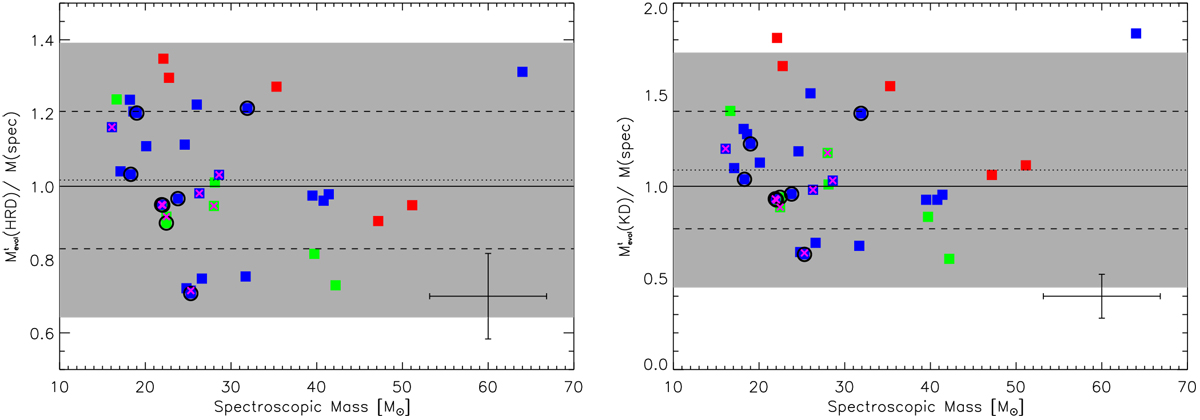
Ratio of evolutionary masses (as derived from the HRD and KD, left and right, respectively) to spectroscopic mass. The symbols and colour-coding are the same as in Fig. 3. The dashed lines and the shaded area correspond to a difference of ± 1σ and 2σ from the one-to-one value, respectively. Typical error bars for the mass ratios are indicated.
Current usage metrics show cumulative count of Article Views (full-text article views including HTML views, PDF and ePub downloads, according to the available data) and Abstracts Views on Vision4Press platform.
Data correspond to usage on the plateform after 2015. The current usage metrics is available 48-96 hours after online publication and is updated daily on week days.
Initial download of the metrics may take a while.