Fig. 3
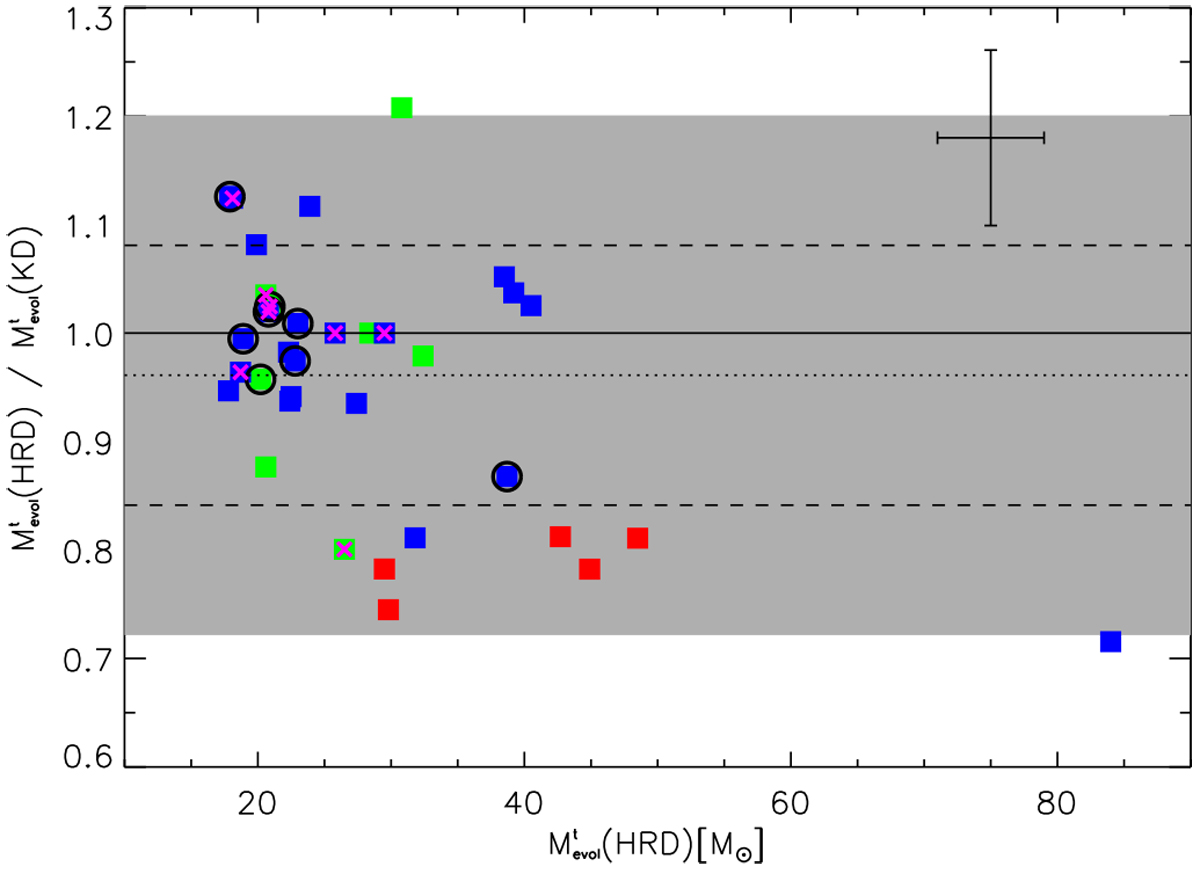
Ratio of evolutionary masses as derived from the HRD, and KD, respectively. The symbols and colour-coding are the same as in Fig. 2. The full line indicates the one-to-one relation, the dotted line indicates the mean value of the mass ratio. The dashed lines and the shaded area correspond to a difference of ± 1σ, and 2σ from the mean value, respectively. Black circle indicate stars with vsin i ≥ 200 km s−1, while pink crosses indicate stars whose analysis relied on UV spectra only (no optical data available). A typical error bar for the mass ratio is indicated.
Current usage metrics show cumulative count of Article Views (full-text article views including HTML views, PDF and ePub downloads, according to the available data) and Abstracts Views on Vision4Press platform.
Data correspond to usage on the plateform after 2015. The current usage metrics is available 48-96 hours after online publication and is updated daily on week days.
Initial download of the metrics may take a while.