Fig. 15
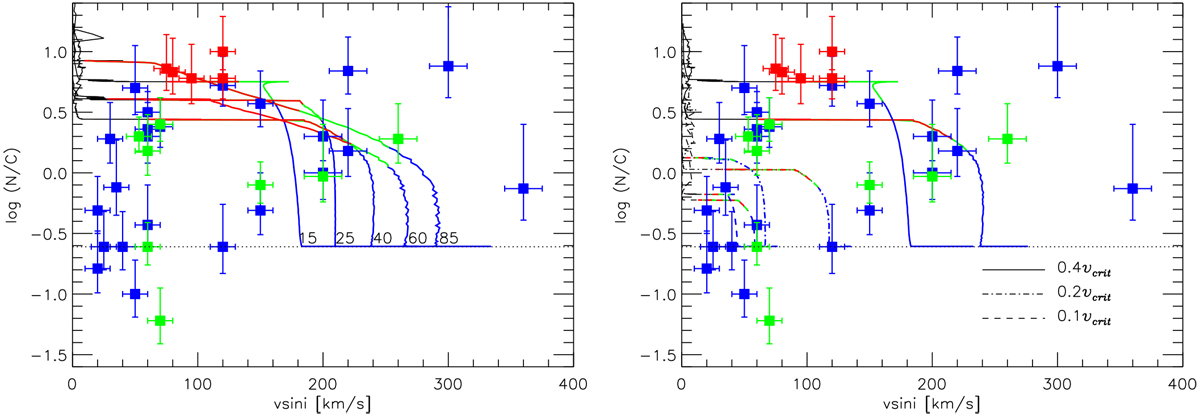
log (N/C) as a function of projected rotational velocity (vsin i) for the sample stars. Left: evolutionary tracks are labelled by initial mass (initial rotation vinit = 0.4vcrit). We overplot in blue, green, and red the parts of the tracks that correspond to the minimum and maximum value of log g as measured for the dwarfs, giants, and supergiants, respectively. Right: models with a range of initial rotation vinit = 0.1vcrit, 0.2vcrit, and 0.4vcrit, and initial masses of 15 M⊙ and 40 M⊙. In both panels, a horizontal scaling corresponding to a factor π/4 to account for an average projection effect has been applied to the theoretical curves. The horizontal dotted line indicates the baseline N/C for the SMC used in the models.
Current usage metrics show cumulative count of Article Views (full-text article views including HTML views, PDF and ePub downloads, according to the available data) and Abstracts Views on Vision4Press platform.
Data correspond to usage on the plateform after 2015. The current usage metrics is available 48-96 hours after online publication and is updated daily on week days.
Initial download of the metrics may take a while.