Fig. 14
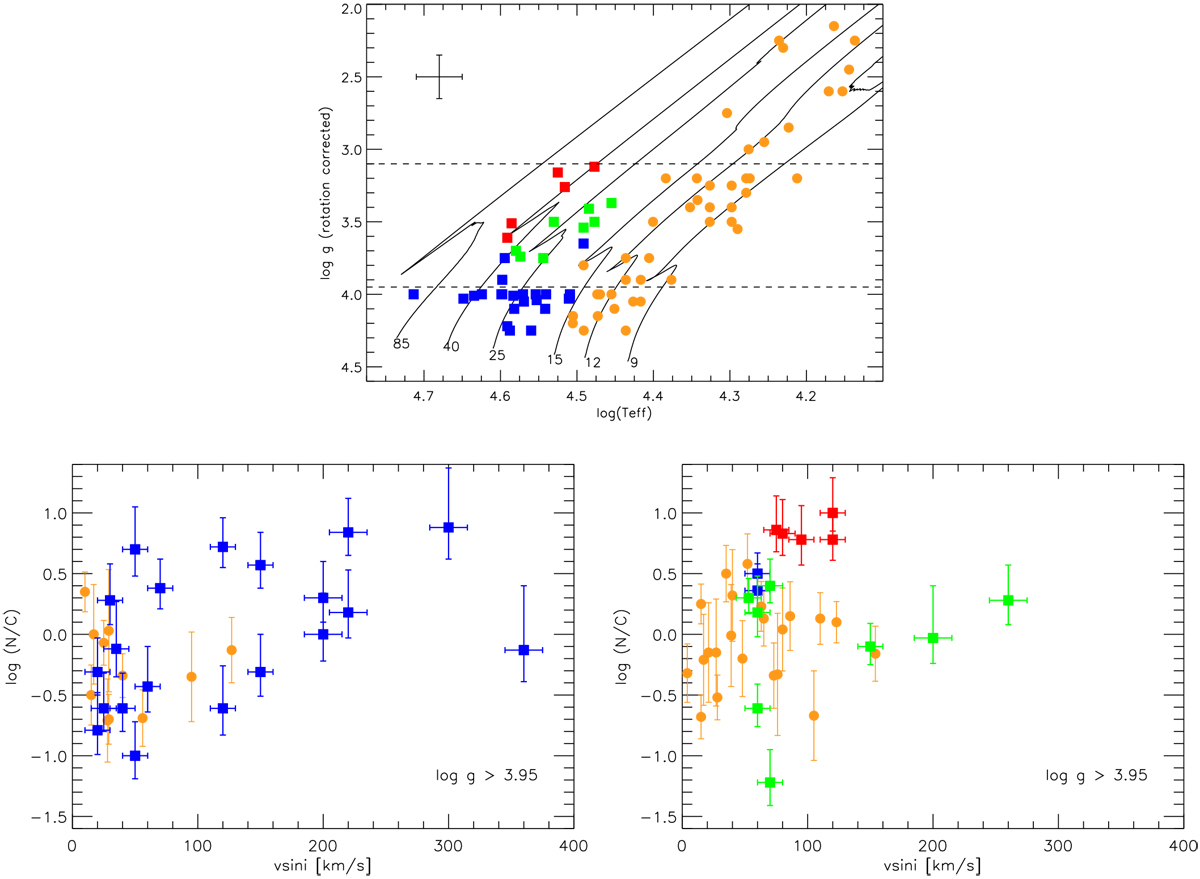
Upper panel: logg – Teff diagram for the SMC O stars (squares) and the SMC B stars (orange circles) of Hunter et al. (2009). The evolutionary tracks are from Georgy et al. (2013). The dashed horizontal lines mark the log g limits used in the lower panels. Lower panels: log (N/C) as a function of projected rotational velocity (v sin i). Left panel: stars with logg > 3.95, right panel: those with 3.1 < log g < 3.95. We have omitted stars from the Hunter et al. sample that have only upper limits on the nitrogen abundance.
Current usage metrics show cumulative count of Article Views (full-text article views including HTML views, PDF and ePub downloads, according to the available data) and Abstracts Views on Vision4Press platform.
Data correspond to usage on the plateform after 2015. The current usage metrics is available 48-96 hours after online publication and is updated daily on week days.
Initial download of the metrics may take a while.