Fig. 13
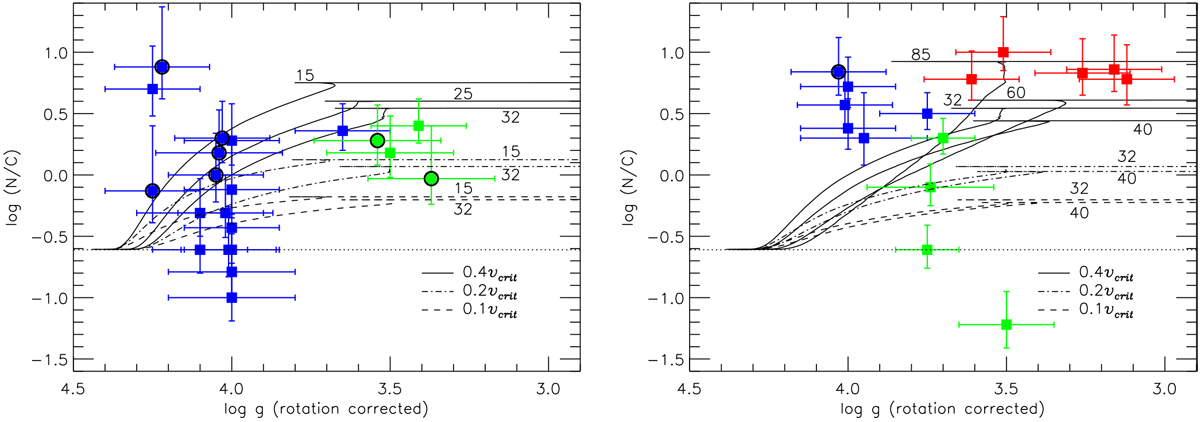
log (N/C) vs. logg for the sample stars. The evolutionary tracks are labelled by initial mass. Full lines show models with initial rotation vinit = 0.4vcrit, dot-dashed and dashed lines show models with vinit = 0.1vcrit and 0.2vcrit, respectively. Left: stars less massive than the average mass of the sample, i.e. 30 M⊙. Stars rotating faster than 200 km s−1 are highlighted by thick black circles. Right: stars with initial masses above the average for the whole sample. See text for more details
Current usage metrics show cumulative count of Article Views (full-text article views including HTML views, PDF and ePub downloads, according to the available data) and Abstracts Views on Vision4Press platform.
Data correspond to usage on the plateform after 2015. The current usage metrics is available 48-96 hours after online publication and is updated daily on week days.
Initial download of the metrics may take a while.