Fig. 10
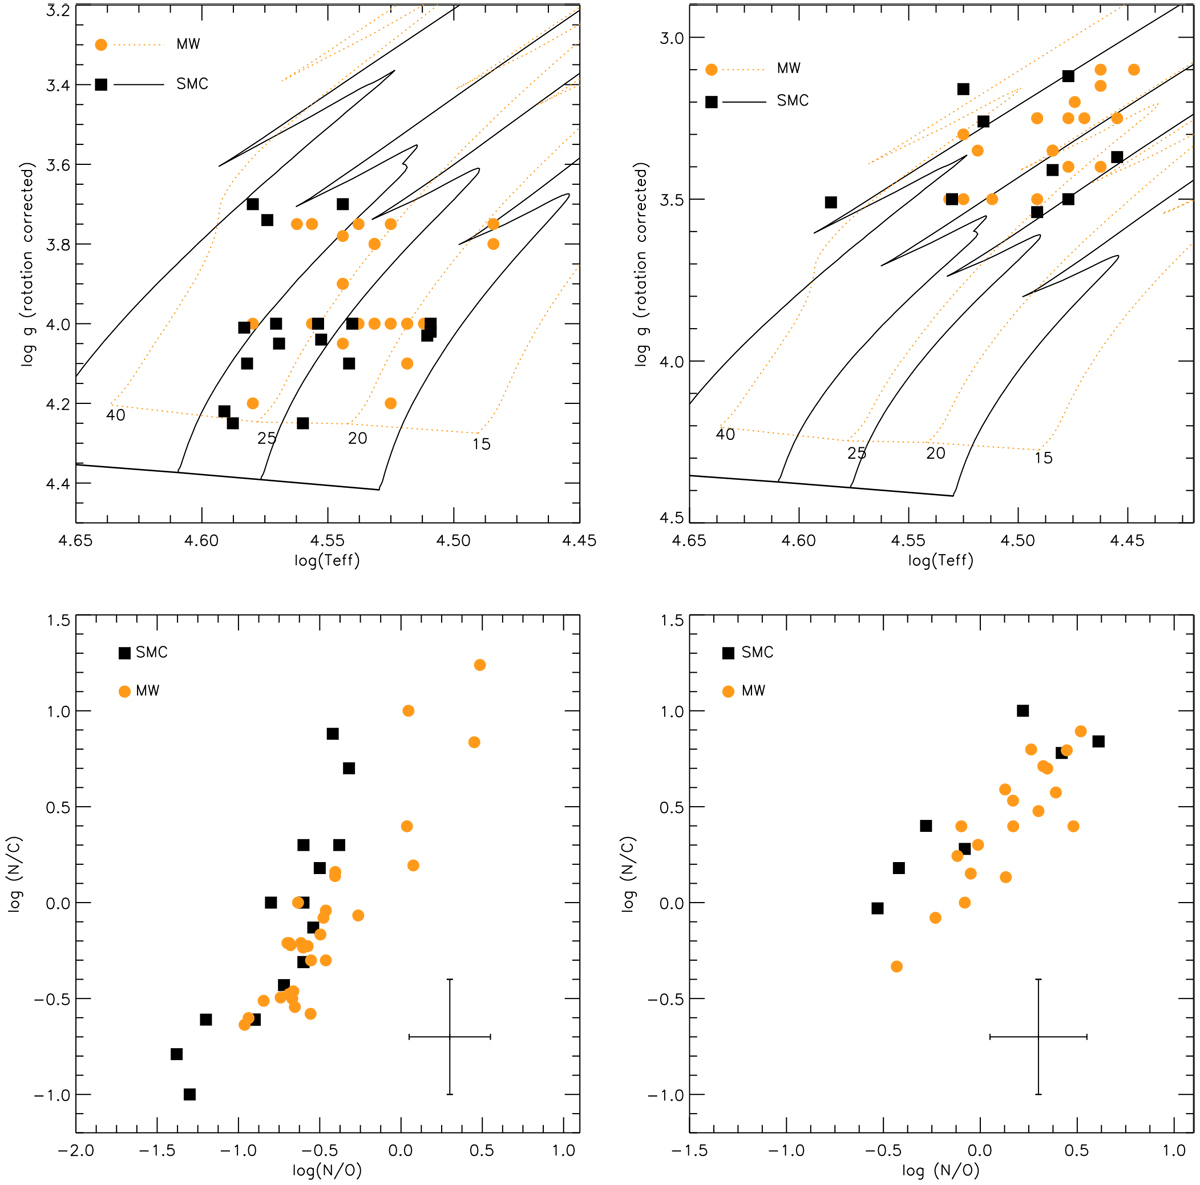
Top: Kiel diagram for SMC stars (black squares and solid lines, this study) and MW stars (orange circles, dotted lines, Martins et al. 2015). Stars have been selected to overlap significantly in the KD, either on the MS (top left panel) or on the post-MS (top right panel). Bottom: log (N/C) vs. log (N/O) diagram for the same sub-sample of stars. Evolutionary tracks are from Ekström et al. (2012) and Georgy et al. (2013).
Current usage metrics show cumulative count of Article Views (full-text article views including HTML views, PDF and ePub downloads, according to the available data) and Abstracts Views on Vision4Press platform.
Data correspond to usage on the plateform after 2015. The current usage metrics is available 48-96 hours after online publication and is updated daily on week days.
Initial download of the metrics may take a while.