Fig. 5.
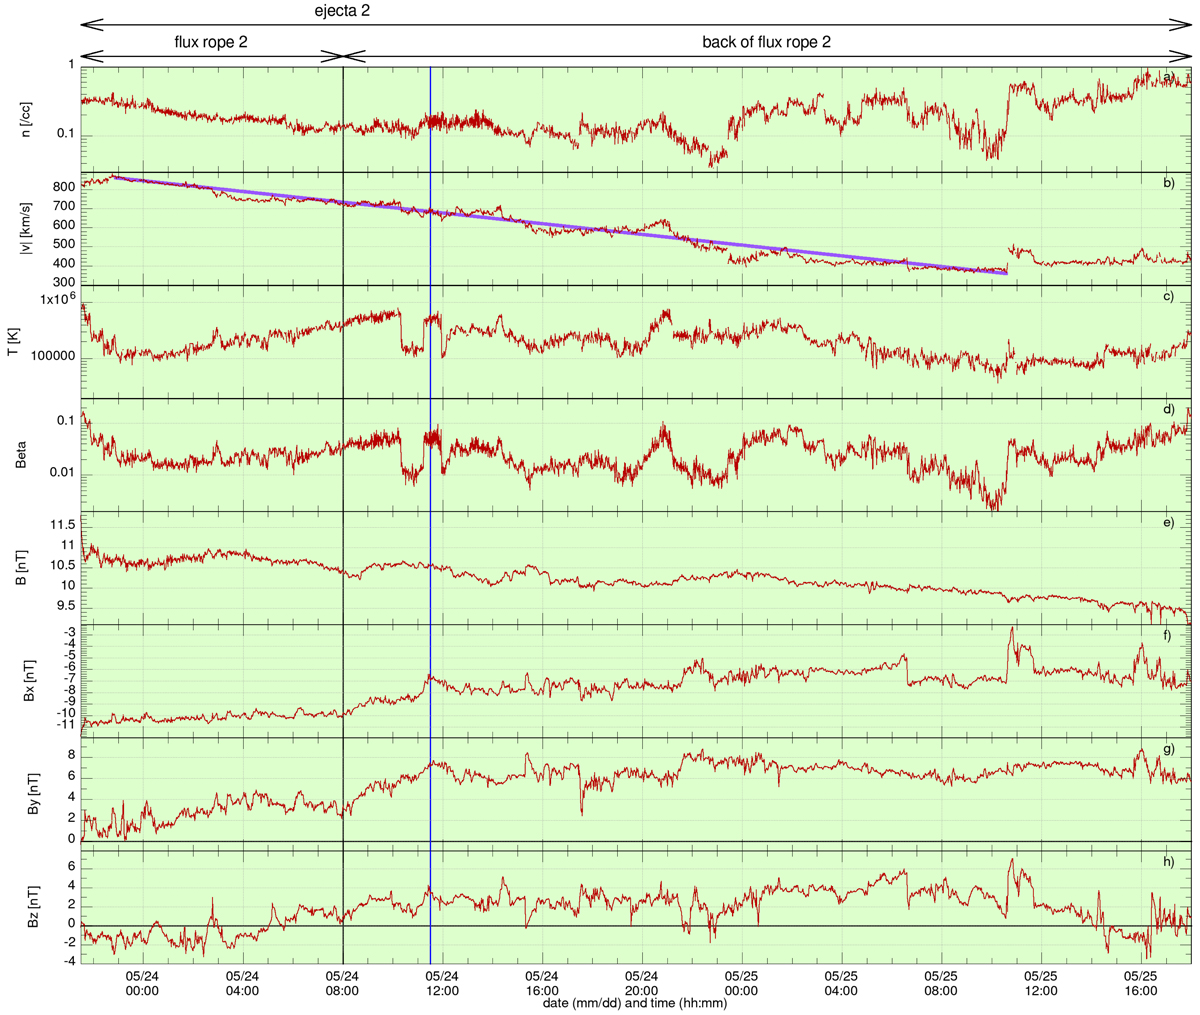
ACE in situ measurements at L1. (a) The number density (in cm−3) on a logarithmic scale; (b) the plasma speed (in red) and a straight line (indigo) that has been added to illustrate the very long, almost linear plasma-speed decrease between 2002 May 23 at 22:54 UTC and 2002 May 25 at 10:35 UTC; (c) the plasma temperature on a logarithmic scale; (d) the plasma beta on a logarithmic scale; (e) the magnetic field strength; (f), (g), and (h) the components of the magnetic field in GSE. The background colours illustrate the different structures in the solar wind: the sheath of the second ICME is in light red (on 2002 May 23 between 15:10 UTC and 21:30 UTC); the magnetic ejecta of the second ICME is in light green (between the 2002 May 23 at 21:30 UTC and the 2002 May 25 at 18:00 UTC). The end of the second flux rope is represented by a vertical black line. The flux rope back itself is separated into two regions by a vertical blue line.
Current usage metrics show cumulative count of Article Views (full-text article views including HTML views, PDF and ePub downloads, according to the available data) and Abstracts Views on Vision4Press platform.
Data correspond to usage on the plateform after 2015. The current usage metrics is available 48-96 hours after online publication and is updated daily on week days.
Initial download of the metrics may take a while.